Request a Callback
+971 43801666
 May 13, 2025

Python is essential in data analysis and data science as it is easily applicable, offers specialised libraries, and the community is extensive and helpful. Zipdo surveys indicate that more than 78% of data professionals use Python as their primary coding language. It is not just a popular tool, it is a powerful user-friendly platform that can do everything, including discovering business insights, creating forecasting models and automating data activities.
The easy learning and powerful nature of Python is what makes it a language of choice among data professionals of all levels. This guide will explore why Python is essential in data analysis and data science, the differences and similarities between the software and other tools, and how you can begin to learn how to use this in-demand language. Are you ready to discover the possibilities of Python? Let’s dive in.
The process of data analysis is the compilation, tabulation, explanation and representation of facts to indicate useful information, and imply conclusions and justify decisions. It is not just number crunching but converting raw data into understandable and actionable information.
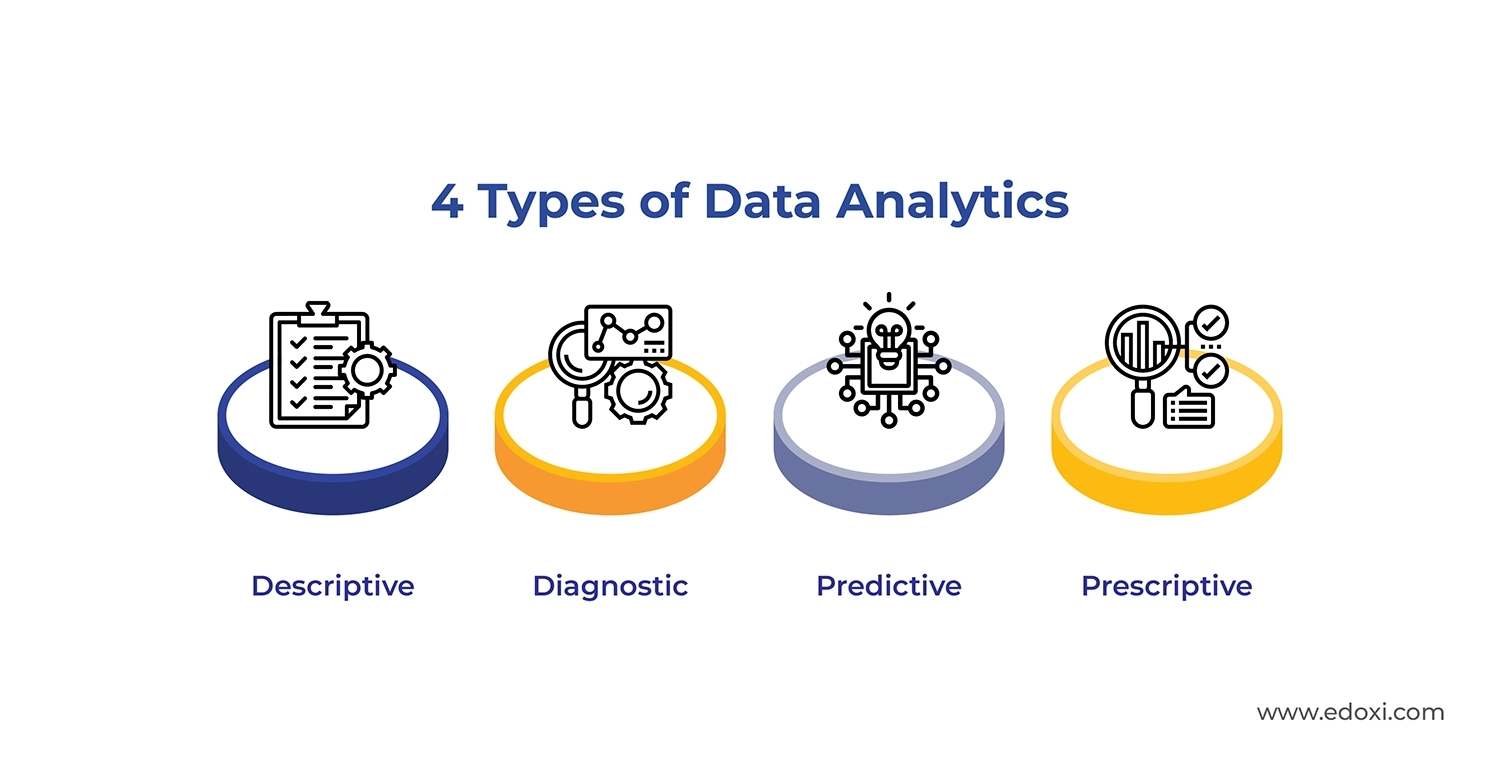
Whether you need consumer trends, business performance metrics or streamlined processes, the data analysis enables you to make decisions based on facts, rather than assumptions. These are the four primary data analytics methods:
Descriptive Analysis (What happened?)
Diagnostic Analysis (Why did it happen?)
Predictive Analysis (What is likely to happen?)
Prescriptive Analysis (What action should we take?)
By effectively and widely carrying out these analyses, particularly when dealing with huge data sets. This is when essential tools like Python come into play.
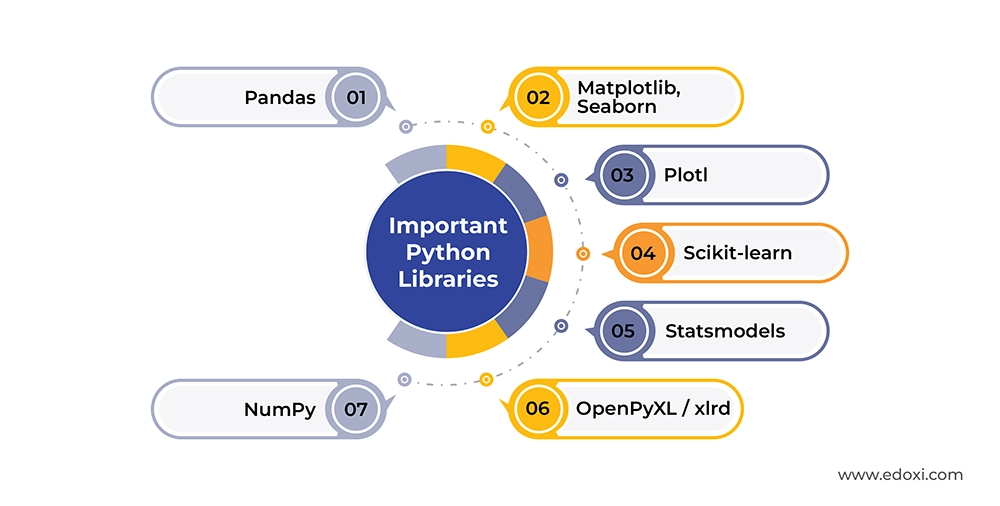
The strengths of python such as large libraries, readable code, and flexibility, make it a foundation of data-analytics education. Data processing, numeric analysis, and machine learning are made easy by libraries like Pandas, NumPy, and scikit-learn. Being easy to use, it will attract users of any level of skill, and its open-source status allows it to remain free, as well as be supported by a friendly community. We can enumerate the most important reasons.
Python is user-friendly with a readable syntax and easy-to-follow rules. With or without any understanding of programming, you can begin creating useful scripts in a relatively short time, which is why it has found popularity in data-related jobs.
These libraries lower the development time and minimise the complexity of the code, which enables you to concentrate on insights.
Visualisation libraries in Python also allow you to create line charts, histograms, scatter charts, heat maps and interactive dashboards. This facilitates easy exchange of findings with both the technical and non-technical stakeholders.
Python automates time-intensive programs, including cleaning, formatting and generation of reports, which save time and reduce human error. As an example, you may create a script that will retrieve data from a database, clean and process it, display it in a dashboard, and email it automatically.
Python is compatible with a large variety of systems:
This is the reason Python is a viable and future-proof option for any data professional.
Python has a massive and vibrant community. You will never feel alone, be it when you need to debug a problem, find a tutorial, or build up an open-source software. There are websites, such as Stack Overflow, GitHub and Reddit that house innumerable knowledgeable users who are ready to assist.
Are you prepared to start working with Python in data analysis? Take these roadmap steps step-by-step:
Build a strong programming foundation:
Learn the fundamental library when analysing data:
Ready raw data to be analysed:
Turn insights into visuals:
Identify patterns and trends:
Apply your skills practically:
Showcase your analytical skills:
Python is widely used in roles such as:
Data science is a component of various fields that is a fusion of statistics, programming, data analysis and expertise of a domain to derive meaning out of both structured and unstructured data. It does not just stop at analysis using advanced strategies to resolve more complex problems, but goes on to include machine learning, artificial intelligence and predictive modelling.
In other words, data science transforms unorganised data into organisational wisdom that helps companies make wiser decisions, increase their productivity, predict the future, and create data-driven solutions.
It may be the suggestions of products on e-commerce websites, fraud identification in the banking systems, sales forecasting, or the development of AI-initiated chatbots and so forth: the field of data science is an essential component of modern industries.
The main elements of data science are the following:
With an effective combination of these processes, organisations might discover valuable insights from huge datasets.
Do check this detailed evaluation on what Data Science is and how it works.
Python is an important part of data science due to its simplicity, flexibility and rich library ecosystem. It allows data scientists to do all the data cleaning and data mining to sophisticated machine learning and artificial intelligence creation, easily. We will now consider why Python is the language of choice in data science.
Python is written in a readable and simple syntax, which is simple even for beginners. Data scientists will not spend as much time being concerned with complicated details of programming.
Python’s ecosystem is one of its biggest strengths. Key libraries include:
These tools make complex tasks easier and significantly reduce development time.
Python prevails in the sphere of machine learning and artificial intelligence. Python has frameworks enabling quick exploration and deployment of models, deployed through predictive analytics to deep learning models.
Clear communication of insights is crucial in data science. Python allows the creation of:
This helps both technical and non-technical stakeholders understand findings easily.
Python enables automation of repetitive tasks such as:
It also scales well when integrated with big data tools like Spark and Hadoop.
Python integrates smoothly with:
This flexibility makes Python future-proof for data science careers.
Python boasts an enormous number of developers and data scientists. It has thousands of tutorials, open-source projects, and active forums; therefore, support is never a problem.
Ready to start your Python journey in data science? Follow this simple roadmap:
Build a strong foundation in:
Start working with core data science tools:
Share projects on GitHub, Kaggle, or Medium to build credibility and attract opportunities.
Python is widely used in roles such as:
For a detailed roadmap, explore: A Complete Guide to Data Science Career Path
At this point, we can have a closer examination of data analysis and data science to understand them better. The concepts of data analysis and data science are interchanged, though they are very different regarding their purpose, coverage, and expertise. The main differences are.
|
Feature |
Data Analysis |
Data Science |
|
Primary Goal |
Analyse past data to find insights |
Predict future outcomes & automate decisions |
|
Scope |
Narrower deals mainly with known data |
Broader involves building new models and systems |
|
Tools |
Excel, SQL, Python (Pandas, Matplotlib) |
Python (Scikit-learn, TensorFlow), R, Big Data tools |
|
Skills Required |
Visualisation, Statistics, and data cleaning |
Programming, machine learning, data engineering |
|
Outcome |
Reports, dashboards, data visualisations |
Predictive models, AI solutions, algorithms |
In simple terms, data analysis is a subset of data science. Analysts concentrate on describing the "what" and "why," whereas data scientists construct predictive models to find "what's next."
Some Additional Thoughts on Python
With its wide usage and widespread industry support, Python proficiency makes you extremely desirable in the marketplace. |
Python is not only a programming language, but it's also a doorway to the world of data. From trend analysis and visualisation of results to the development of machine learning models, Python enables professionals to unlock value from data in meaningful and efficient ways.
Whether you're a beginner to data or looking to enhance your skills, Python is an essential skill to learn to remain valuable in a data-driven world.
Getting started? Learn Python today and open the door to infinite career possibilities in data science and data analysis.