Request a Callback
+971 43801666
 Mar 28, 2025
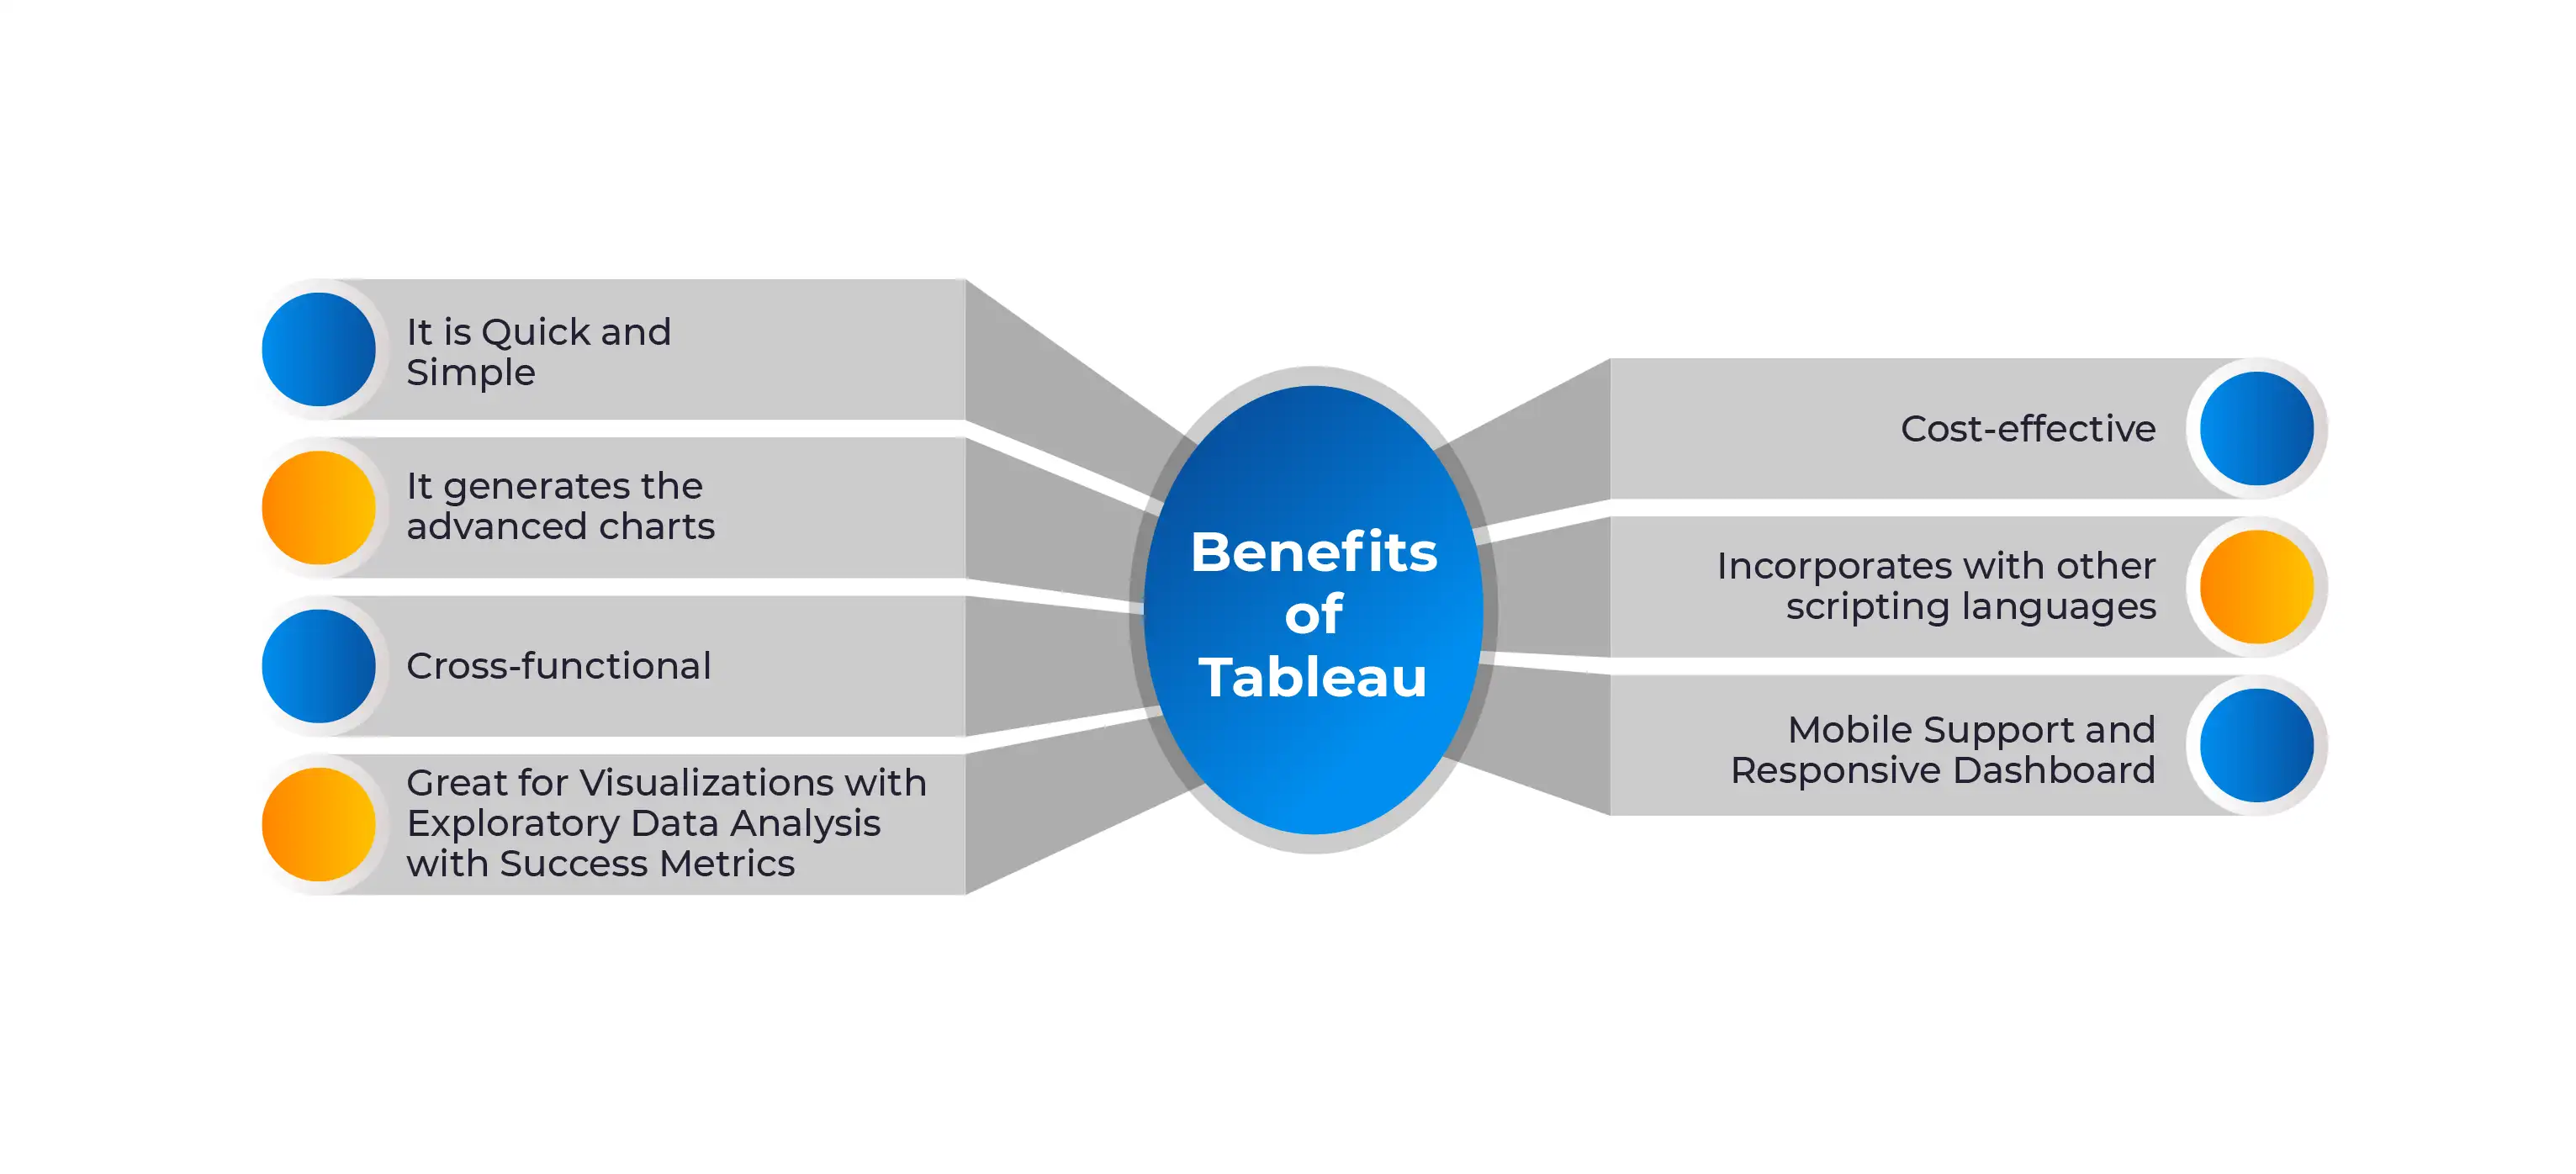
Tableau is a visual analytics platform that is revolutionizing the way we use data to solve problems by enabling individuals and companies to make the most of their data. As a data scientist, you constantly deal with large amounts of data. Organizing and making sense of this data can be a challenge. A tableau is a tool that can help you visualize your data, making it easier to understand and work with.
Read Also: Best Data Analytics Tools
Tableau is widely used in the Business Intelligence business, and raw data is quickly simplified to any format that users can understand. Dashboards are used to visualize data, and data should be displayed in tabular format. It is also utilized in reporting and is commonly referred to as a reporting tool. It aids in data exploration, visualization, and report preparation for the same data. It is written in C++.
Tableau tools can be classified into several categories according to their function. Tableau includes the following tools;
Developer tools: This category includes Tableau development tools such as dashboard building, charts, report generating, and visualization. Tableau products in this category include Tableau Desktop and Tableau Public.
Sharing Tools: As the name implies, the objective of these Tableau products is to share visualizations, reports, and dashboards built with developer tools. Tableau Online, Server, and Reader are examples of products in this category.
Read Also: Top Data Analytics Skills
Tableau links and extracts data from many sources. It can retrieve information from every platform imaginable. Tableau can extract data from a simple database like Excel or PDF to a complicated database like Oracle, a cloud database like Amazon Web Services, Microsoft Azure SQL database, Google Cloud SQL, and several other data sources.
When you launch Tableau, ready data connectors are accessible, allowing you to connect to any database. The number of data connectors supported by Tableau varies depending on the version of the software that you have purchased. The extracted data can be connected live or extracted to Tableau Desktop's data engine. This is where the data analyst and data engineer collaborate with the retrieved data to create visualizations. Dashboards are built and shared with users as static files. The file is viewed by the users who receive the dashboards using
Read Also: Data Analyst Salaries
Data scientists are always looking for ways to more effectively analyze data. Tableau is one tool that can help them do that. Here are some of the benefits of using Tableau;
Now, let us take a brief look into each benefit of Tableau for Data scientists;
Tableau, as a broader benefit, may be fairly rapid and straightforward to use. You can develop a dashboard in minutes if you have a CSV file ready. This dashboard will have numerous sheets with various visualizations, such as a map, chart, or table (etc.). It's truly as simple as dragging and dropping fields into your sheet and selecting a visualization. Let us now discuss how to incorporate some programming languages.
Tableau is a data visualization application. And for data scientists, using graphs, charts, and maps to comprehend what the data represents is critical. They can generate several types of advanced graphs for this purpose. Some of the most common are as follows:
Read Also: Top Advanced Excel Skills
The most crucial benefit of Tableau for Data Scientists is that you may use the product for its intended purpose – visual data sharing. As a Data Scientist, you may encounter many people in various areas within your firm. It is your responsibility to be able to explain your sophisticated Machine Learning algorithm and its outcomes to others. Visualization is one of the most effective ways to accomplish this. You can use any of the charts to describe your model findings – if you made business improvements, which groupings of data performed better, and so on. Tableau has numerous applications in data science. Here are some of Tableau's advantages in data science.
Tableau's main goal is to facilitate data exploration and visualization. In a variety of data processing programming languages, like R and Python, where the caliber of third-party graphing tools is not always the finest, this is an important but secondary aim.
Sometimes you choose to create a visual model from the preliminary data rather than writing the Python code for the data set. This is known as exploratory data analysis (EDA), and it is a devalued data science courses approach. Along with metrics, it is one of the predecessors that determines a model's success or failure. You can use Tableau to understand a model's early success rate because it has EDA capabilities.
Read Also: Benefits of Advanced Excel certification
Comparatively speaking, Tableau is less expensive than other big data collaboratives like Qlik and Business Objects. The Professional Version of Tableau costs $1,999 plus a maintenance fee per license, keeping businesses in mind. The good news is that Tableau offers a version of their software called Tableau Public that is totally free. The number of Data Sources you may connect to with Tableau Public is limited compared to Tableau Professional, and all visuals must be saved on a public server. Aside from that, Tableau Public is a fantastic option for learning the software because it can create the same amazing dashboards and visualizations as Tableau Professional.
Read Also: Reasons why you should do Data Analytics with a Power BI
Tableau allows users to integrate additional scripting languages like Python and R Programming. The inclusion is carried out to handle complex table calculations in Tableau and to lessen performance concerns. Users can include Python or R to get around performance problems and do complicated table calculations in Tableau. By using Python script to execute data purification operations with packages, the workload on the software can be reduced. However, Tableau does not accept Python as a native scripting language. Consequently, you can import some of the packages or visuals. With Python for Power BI, you can see how this is handled, though.
Tableau Dashboard includes a fantastic reporting function that enables you to tailor the dashboard precisely for a given device, like a laptop or mobile phone. Tableau makes modifications to ensure that the correct report is sent to the appropriate device based on the device the user is reading the report.
Read Also: Benefits Of Tableau For Data Scientists
Tableau is a necessary component of any influential data scientist's toolkit. Clients want the degree of simplicity and engagement that can be generated with this incredible technology, and businesses are mandating it as a requirement for employment.
Read Also: Top Data Professional Tech Jobs In The Middle East