Request a Callback

+971 4380 1666
 Sep 18, 2026
If you are deciding whether to learn Excel, Power BI, or Tableau in Kuwait, the best starting point depends on your current skills and career goals. Excel is generally a practical foundation for spreadsheets, formulas, data cleaning, and basic analysis, while Power BI and Tableau are designed more specifically for data visualization, interactive dashboards, and business intelligence.
For beginners, learning Excel first can help build core data-handling skills before moving into Power BI or Tableau. However, professionals who already work with spreadsheets may choose Power BI or Tableau to develop more advanced reporting and visualization skills. In Kuwait, the choice can also depend on the type of role you are targeting, such as accounting, finance, business analysis, reporting, or data analytics.
This guide compares Excel vs Power BI vs Tableau, including their key features, learning difficulty, common uses, career applications, and how to decide which tool to learn first.
|
Excel vs Power BI vs Tableau: Which Tool to Learn First?
|
If you’re planning a data analytics career in Kuwait, should you learn Excel, Power BI, or Tableau?
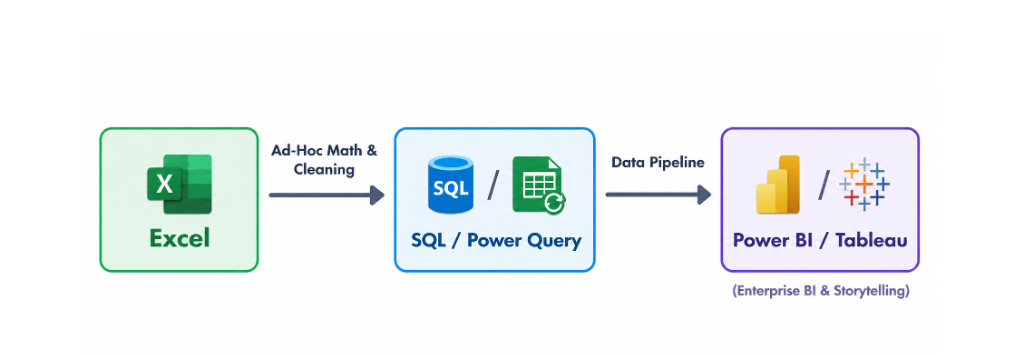
For beginners, Excel is the best starting point, followed by SQL for working with databases. Then, add Power BI or Tableau for business intelligence and reporting.
This roadmap cuts through the noise with a clear, sequential path built around what Kuwait employers actually ask for: Excel fundamentals, relational SQL, a primary BI tool like Power BI or Tableau, and a portfolio that ties it all together. Follow it phase by phase, and you'll build skills in the order that hiring managers expect to see them.
| Your situation | Best next step |
|---|---|
| Starting from zero | Excel |
| Comfortable with Excel | SQL |
| Comfortable with Excel + SQL, targeting Microsoft-heavy companies | Power BI |
| Comfortable with Excel + SQL, job description names Tableau | Tableau |
| Targeting banking | Excel + SQL + whichever BI tool the posting names |
| Commonly useful for oil & gas analytics | SQL + Power BI + data modelling |
| Targeting reporting / MIS roles | Excel + Power BI |
| Want data science later | SQL + Python + statistics |
| Building a visual portfolio | Power BI or Tableau Public |
Check out: 10 Tips to Build a Resume for Data Analyst
Kuwait is heavily investing in digital transformation as part of its New Kuwait 2035 national vision. The government has identified digital capability building as a key national priority, driving increased demand for skilled data professionals across all commercial sectors.
Kuwait's Central Agency for Information Technology (CAIT) also launched the second edition of its Digital Skills Development Initiative in partnership with Google Cloud. According to CAIT, this initiative focuses on advanced digital capabilities, including cloud computing, artificial intelligence, and data literacy, to prepare local talent for a tech-driven economy.
For an aspiring data analyst in Kuwait, this macro shift means one thing: the ability to turn raw organisational data into reliable, actionable insights is now essential across major regional industries. Mastering data analytics is your gateway to capitalising on this transformation. A structured Data Analytics course provides the essential tools, hands-on projects, and practical experience needed to stand out in Kuwait’s evolving job market.
| Factor | Excel | Power BI | Tableau |
|---|---|---|---|
| Best for | Spreadsheet analysis, modelling, ad-hoc reporting | BI dashboards, semantic models, Microsoft-centric environments | Visual analytics and interactive exploration |
| Learning curve | Low to moderate | Moderate (DAX takes practice) | Moderate to steep |
| Core strength | Formulas, PivotTables, Power Query | Power Query, DAX, semantic modelling | Visual exploration and dashboard design |
| Cost | Usually included in Microsoft 365 | Desktop is free; paid service tiers apply for sharing/collaboration | Public version is free; paid tiers apply for team/enterprise use |
| Kuwait relevance | Appeared repeatedly in the postings reviewed for this article | A strong option, especially for Microsoft-centric employers | Also relevant, including at organisations like NBK that have publicly invested in Tableau skills |
Neither Power BI nor Tableau is simply "better with big data" in the abstract. Real-world performance depends on how the data model is built, whether you're using an import or a live/DirectQuery-style connection, and the underlying data source. Excel, meanwhile, can handle far more than the classic worksheet-grid limit once you're using Power Query and the Data Model, though it's still not a substitute for a dedicated BI platform at scale.
Excel remains one of the most common starting points for aspiring analysts. It handles cleaning, formulas, pivot tables, and quick reporting, and it stays useful alongside BI platforms for ad-hoc analysis, reconciliation, and modelling even once you've moved on to Power BI or Tableau.
An Excel Training gives beginners a practical environment for learning how to inspect, clean, reconcile, and validate data, much of which can be automated with Power Query and formulas rather than done by hand before moving into more automated BI workflows.
Power BI turns raw data into interactive dashboards. It's built by Microsoft and connects tightly with Excel, Teams, and SharePoint. Power BI is more cost-effective, starting around $14 per user per month, and integrates deeply with the Microsoft ecosystem, including Microsoft Fabric and Copilot.
According to Microsoft Learn's PL-300 Data Analyst Framework, professional Power BI workflows break down into four clear functional areas:
Prepare Data (25–30%): Connect to data sources and clean messy datasets using Power Query.
Model Data (25–30%): Define star schemas, establish table relationships, write DAX (Data Analysis Expressions) measures, and optimise performance.
Visualise and Analyse Data (25–30%): Create dynamic reports, configure visuals, and extract actionable patterns.
Deploy and Secure Assets (15–20%): Manage workspaces, configure Row-Level Security (RLS), and set up automated dataset refreshes.
Microsoft's PL-300 Data Analyst certification framework organises professional Power BI work around preparing data, modelling data, visualising and analysing it, and managing and securing Power BI assets; all four are legitimately part of the Power BI Data Analyst role, not just the first three.
For a beginner building core analyst skills, prioritise Power Query, basic data modelling, core DAX measures, and dashboard design first through Power BI Training. Workspace management, security, and deployment are genuine professional skills, but they're reasonable to pick up after you've got the core analyst workflow down.
Related Reading: Reasons Why You Should Do Data Analytics With Power BI
Power BI Desktop is free and enough to build a full portfolio. Paid Power BI licensing (needed for publishing and sharing reports through the Power BI service) starts in the low tens of dollars per user per month, with higher tiers for enterprise features; check Microsoft's current pricing page before budgeting, as this changes periodically.
Check Out: Top Job Roles You Can Pursue After Completing A Power BI Course
Tableau is a visual analytics tool built around drag-and-drop exploration and interactive storytelling. It can be particularly relevant in organisations that already use Tableau, including some multinational and consulting environments and, based on the Kuwait postings reviewed here, in at least some local banking roles too.
Cost: Tableau's paid tiers are generally more expensive than Power BI Pro at list price, though this varies by licensing model and contract; check Tableau's current pricing before deciding.
Tableau Public is, as the name suggests, public. Anything you publish there is visible to anyone. Never upload confidential employer data or sensitive personal information; use sample or open datasets instead.
Read: What is Data Analytics? Definition with Examples
If you are a complete beginner, Excel should come first. Before setting up database connections or configuring DAX measures, you must learn how to audit raw data. Excel forces you to verify dates, reconcile missing values, identify duplicates, and confirm business metrics manually.
Also Read: Power BI Vs Excel: Which One Should You Learn in 2026
SQL is non-negotiable for modern analysts. Before you visualise data in Power BI or Tableau, you must extract it from relational databases. It is one of the most valuable technical skills for a data analyst, because many roles require pulling data directly from relational databases before it ever reaches Excel, Power BI, or Tableau. It isn't strictly universal; some entry-level roles get by without it, but the AUK posting above calls it out specifically as a core requirement, and it's a strong CV differentiator either way.
Basic SQL syntax (SELECT, FROM, WHERE, GROUP BY) can usually be learned within a few weeks of regular practice. Becoming genuinely job-ready- joins, CTEs, window functions, performance considerations- takes longer.
Technical tools are only part of the job. Data analysts also need to understand how to prepare data, interpret results, and turn analysis into useful business decisions.
| Industry | Typical analytics use |
|---|---|
| Banking & financial services | Risk, fraud detection, customer segmentation, profitability |
| Oil & gas | Production monitoring, maintenance, supply chain, operational KPIs |
| Retail & e-commerce | Sales performance, inventory, customer behaviour, margins |
| Telecommunications | Churn, ARPU, customer segmentation, network KPIs |
| Healthcare | Operations, patient flow, resource utilisation |
| Public sector | Service delivery metrics, population and economic indicators |
National Bank of Kuwait's public investment in Tableau training is a concrete local example in the banking row above; oil & gas, retail, and telecom postings on Kuwait job boards regularly echo the same core Excel + SQL + BI combination.
The cost of learning Excel, Power BI, and Tableau can vary depending on whether you're learning for personal development, building a data analyst portfolio, or using the tools professionally.
For beginners, the good news is that you can learn all three BI and analytics tools and build portfolio projects with little or no software cost.
If you already have Microsoft 365 or Microsoft Office, Excel is usually included, so there may be no additional software cost. Excel is also a practical starting point for learning data cleaning, formulas, PivotTables, and basic reporting.
Power BI Desktop is free, making it one of the most accessible tools for beginners learning business intelligence. You can use the desktop application to practise data analysis, create dashboards, and build portfolio projects without paying for a Power BI license. Paid licensing is generally needed for publishing, sharing, and collaboration through the Power BI service.
Power BI Pro is listed at $14/user/month and Power BI Premium Per User at $24/user/month, both billed annually. Prices can vary by country and may change, so check Microsoft's current pricing before purchasing.
Also learn: Top Benefits of Learning Power BI for Your Career
Tableau Public is free for learning and building a public portfolio. It allows you to create and publish interactive Tableau visualisations, but anything published on Tableau Public is publicly accessible. Never upload confidential company data or sensitive personal information.
For professional use, Tableau's Standard tier lists Creator at $75/user/month, Explorer at $42/user/month, and Viewer at $15/user/month, billed annually. Tableau deployments also require at least one Creator license.
If you're learning data analytics on a budget, Power BI Desktop is a strong starting point because you can learn the platform and build portfolio dashboards without paying for the desktop software.
Tableau Public is another free option, particularly if you want to develop Tableau skills and showcase interactive visualisations online. You do not need to pay for both Power BI and Tableau while you're learning. Choose the BI tool that best matches the data analyst jobs you're targeting, build a strong portfolio, and learn the second platform later if your career requires it.
If you're starting from zero, use Excel → SQL → one BI platform as your core learning path. For most beginners, Power BI is a practical default; switch to Tableau if your target job descriptions specifically ask for it. Then build the supporting skills that turn tool knowledge into job readiness:
Also find out: How to Become A Power BI Professional
For most candidates targeting jobs in Kuwait, the Microsoft PL-300 (Power BI Data Analyst Associate) certification is currently more versatile. Because Kuwait's enterprise landscape heavily leans on Microsoft infrastructure (Azure, Microsoft 365, SharePoint), the PL-300 is widely recognized by HR screeners.
Absolutely. Both Power BI and Tableau rely primarily on drag-and-drop interfaces, visual query builders, and low-code data transformation tools like Power Query. You do not need traditional programming languages (like Python or R) to build enterprise-grade interactive dashboards.
Using local data makes your portfolio stand out to regional employers. You can access free datasets from:
Excel and SQL are the foundations that showed up most consistently in the Kuwait evidence reviewed here. On top of that:
Start with Excel and SQL, add one BI platform based on who you're targeting, and layer on Python or deeper specialisation once your target roles call for it.
Get a structured course roadmap that takes you from Excel to practical Power BI or Tableau dashboards, built around the tools Kuwait employers actually ask for.
Data analyst salaries in Kuwait generally range from KWD 400 to KWD 1,400 per month, depending on experience, industry, and technical skills:
Entry-Level (0–2 years): ~KWD 300 – KWD 500/month
Mid-Level (3–6 years): ~KWD 600 – KWD 950/month
Senior Analysts / BI Specialists: KWD 1,100 – KWD 1,500+/month
Analysts working in high-paying sectors like Banking (e.g., NBK, KFH), Oil & Gas (KPC, KOC), or Telecom (Zain, STC) typically command salaries at the higher end of these ranges, especially when skilled in both SQL and Power BI/Tableau.