

Edoxi’s 60-hour Online Data Analytics Course aims to equip you with skills to collect, process, analyse, and interpret data to extract meaningful insights. This course is designed to help beginners become expert data analysts through a structured and practical learning path. Whether you are starting fresh or looking to upskill, our Data Analytics course provides the knowledge and tools you need to succeed in the data field.
Our online Data Analyst Course covers essential topics, including data management, Python programming, statistical analysis, and dashboard creation. The course will begin with basic data concepts and gradually move on to more advanced analytics. The training includes a hands-on approach, ensuring that you gain real-world experience while learning each concept step-by-step.
Edoxi’s live online data analytics course includes expert instruction, interactive learning, and access to industry-standard tools. For Corporates, Edoxi offers a 5-day customised Data Analytics Training. It can be delivered at your office, at a hotel, or at Edoxi’s training centre. The corporate training includes team-based projects, assessments, and all travel and refreshment arrangements.
Throughout the Online Data Analytics course, you will also work with real-world datasets from sources like Kaggle and government portals. Practical tasks include cleaning data using Pandas, writing SQL queries, and building dashboards in Power BI and Excel. These activities help you develop the data analysis skills needed for the international job market.
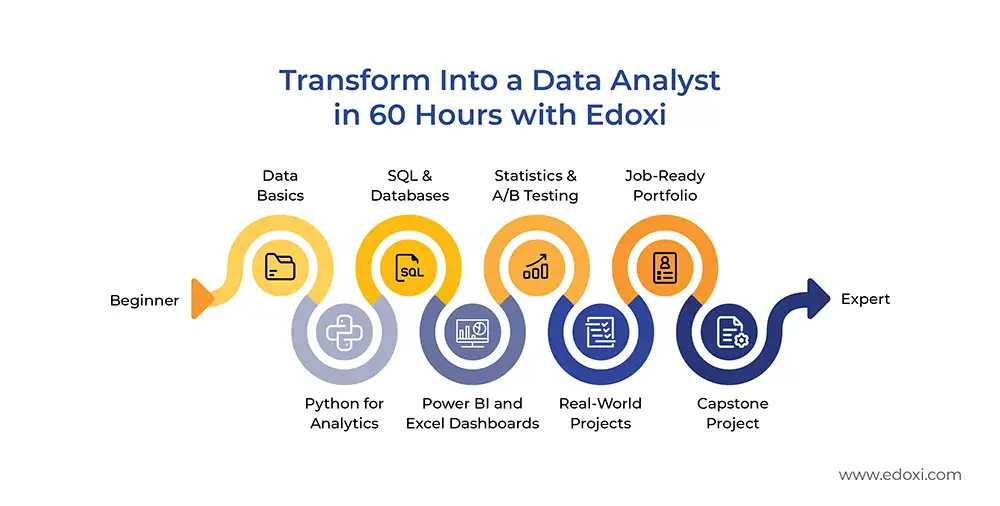
During the Online Data Analytics course, you will complete a capstone project, which will be part of your analytics portfolio. This enables you to demonstrate end-to-end data workflows from collection to presentation. Our practical training approach ensures Edoxians build confidence in analysing data and presenting clear, actionable insights to support business decisions. Upon course completion, you’ll gain a CPD UK-accredited Data Analytics Certification, highly valuable in today’s job market.
This certification is ideal for beginners and career switchers aiming for entry-level data analytics roles. By the end of the Data Analytics course, you will be ready to work as a data analyst, BI specialist, or analytics consultant in different industries such as finance, healthcare, logistics, and e-commerce.
Enrol now and gain the skills and confidence to explore data-driven career opportunities globally.
Practice with Kaggle, government, and Maven Analytics datasets across all modules for authentic industry experience.
Access Microsoft documentation guides, practice notebooks, Excel templates, SQL queries, and Power BI files throughout training.
Engage in live coding, data cleaning drills, SQL writing, and dashboard building with peer reviews.
Progress through modules customised to your skill level, from data fundamentals to advanced analytics with clear milestones.
Master Python, MySQL, Power BI, Excel, SciPy, and Seaborn for complete analytics capabilities.
Complete full data pipeline from cleaning to presentation, building portfolio-ready analytics solutions.
Recent graduates in commerce, engineering, IT, business management, or related disciplines seeking to launch careers.
Current analysts and marketing professionals who want to enhance their capabilities with Python, SQL, and Power BI for deeper data insights.
Professionals in finance, operations, and logistics roles looking to leverage data analytics for forecasting, optimisation, and strategic decision-making.
Technical professionals aiming to expand their skillset into data analytics, combining programming knowledge with business intelligence capabilities.
Industry professionals from healthcare, retail, and e-commerce sectors seeking to analyse operational data for improved efficiency and customer insights.
Individuals from any background with basic computer skills and logical thinking abilities are ready to transition into high-demand data analytics roles.
Edoxi’s Online Data Analytics Course includes practical exercises throughout the syllabus. This ensures that you gain hands-on experience with industry-standard tools and authentic datasets. Each session combines theoretical concepts with immediate application through structured activities using Kaggle datasets, government repositories, and Maven Analytics resources.
Analyse customer behaviour patterns using SQL and Pandas to segment audiences, identify purchasing trends, and create actionable insights for marketing strategies.
Design and execute statistical hypothesis testing on marketing data using SciPy and statsmodels to evaluate campaign effectiveness through p-value analysis.
Clean and transform medical datasets using Power Query, perform exploratory analysis with Python, and create interactive Power BI dashboards.
Develop predictive analytics solutions using historical sales data, applying statistical methods and visualisation techniques to forecast business trends.
Complete a comprehensive data analysis workflow from raw data collection through cleaning, analysis, and presentation, demonstrating mastery of all tools.
Edoxi’s Online Data Analytics Course with Python, SQL, Power BI, and Excel provides a strong foundation for building a successful career in the rapidly growing international data analytics sector.. By the end of the program, you will:

Get expert assistance in getting your Data Analytics Course customised!
Here’s a four-step guide to becoming a certified Data Analytics professional.

Join Edoxi’s Data Analytics Course
Here are a few reasons why you should choose Edoxi for the Data Analytics Course ;
Immerse yourself in real-world data analytics through practical projects that reinforce core concepts and build problem-solving skills.
Create an impressive portfolio featuring five major projects using leading tools such as Python, SQL, Power BI, and Advanced Excel, demonstrating your readiness for the job market.
Start with the fundamentals and advance step-by-step into complex analytics techniques, ensuring a smooth and confident learning journey for beginners and experienced learners alike.
Gain the technical expertise and business acumen required to thrive in today’s fast-growing, data-driven industries.
Benefit from comprehensive guidance, including access to up-to-date tools, curated study resources, version control practices, and career mentorship.
Upon successful completion of the course, you will receive a CPD-UK-accredited course certification. This validates your skills to potential employers.

Our mentors are leaders and experts in their fields. They can challenge and guide you on your road to success!

Nahid S
Nahid S. is an experienced educator with 8+ years of expertise in academia, training, and software development. Skilled in curriculum design, interactive training, and mentorship, she has equipped learners with hands-on skills in data analytics, data science, cloud computing, and software engineering. Nahid is an AWS Academy Accredited Educator, AWS Certified Solutions Architect – Associate, Microsoft Certified: Azure Fundamentals, and Google Certified Educator (Level 1). She brings a strong technical foundation and industry credibility to the classroom, blending theoretical knowledge with practical applications.
Nahid has delivered engaging lectures and practical sessions across core and elective subjects, including Cloud Computing, Python, Machine Learning, and Data Science. Nahid has designed and implemented industry-relevant training programs that boost employability. With a strong focus on student development, she has provided mentorship in projects, internships, and career planning while organising workshops, seminars, and guest lectures to bridge the gap between academia and industry.
Here is the list of other major locations where Edoxi offers the Data Analytics Course