Request a Callback

+971 4380 1666
 Sep 22, 2026
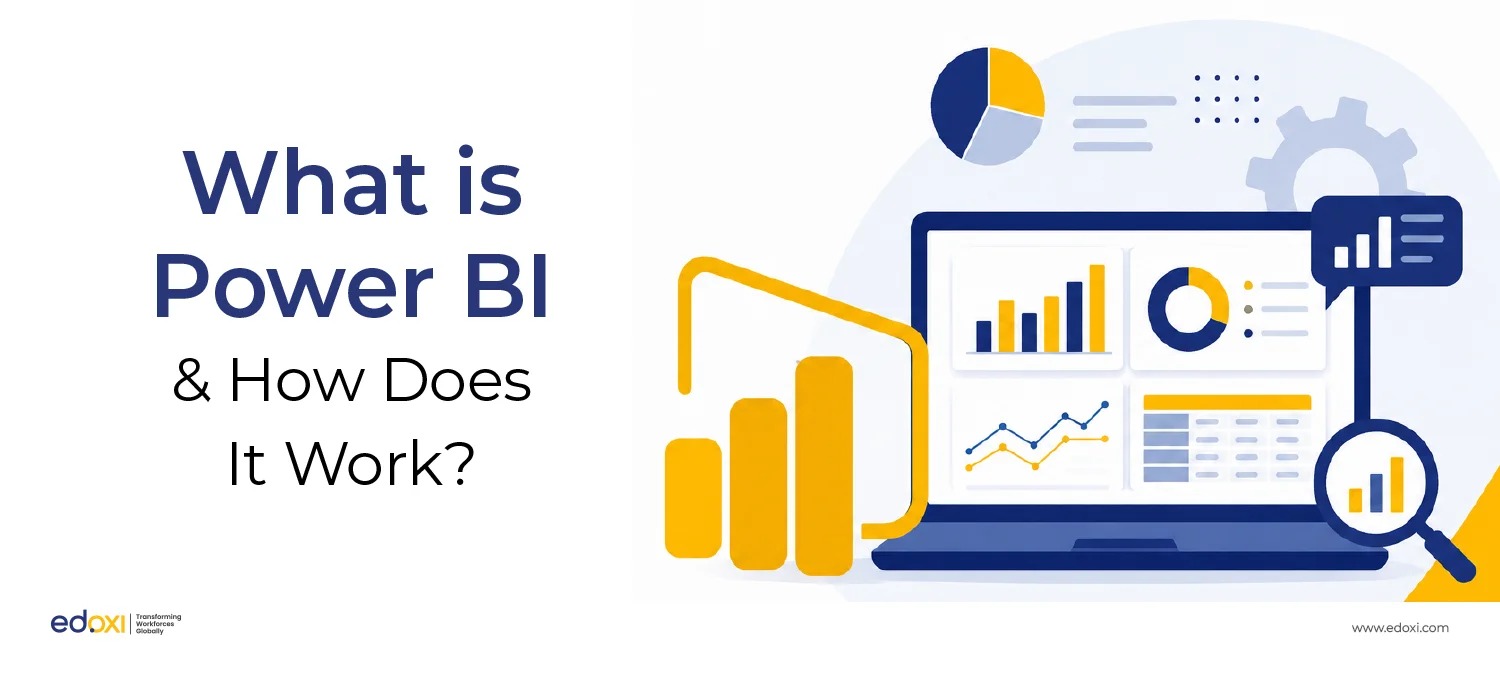
Power BI is Microsoft's business analytics platform. It connects to your data sources, transforms messy numbers into clean tables, and turns those tables into interactive dashboards and reports, all without needing a developer on standby.
It's part software, part service, and increasingly, part AI assistant.
A spreadsheet with forty tabs tells you almost nothing at a glance.
A single, well-built dashboard can tell you everything in five seconds: which region is behind target, which product is quietly outselling the rest, and where the next problem is brewing.
That shift, from digging through rows to simply glancing at a screen, is the entire reason Power BI has become as common in offices as email.
So let's actually answer the question properly: what is Power BI, and how does Power BI work under the hood? No jargon dump, no recycled definitions, just a clear, honestly written explainer.
| At a glance | Detail |
|---|---|
| Owner | Microsoft |
| First released | 2015 |
| Core function | Data visualisation and business analytics |
| Main components | Power BI Desktop, Power BI Service, Power BI Mobile |
| Free tier available | Yes (Power BI Desktop) |
| Global BI market share | Roughly 30% (largest of any single vendor) |
| 1 | Power BI Explained: Why Everyone Suddenly Needs to Know This Tool |
| 2 | How Does Power BI Work? Breaking Down the Engine Room |
| 3 | What Can You Actually Build With Power BI? |
| 4 | What Are the Core Features That Set Power BI Apart? |
| 5 | Who Uses Power BI and Why Is It a Valuable Career Skill? |
| 6 | Is Power BI Worth Learning in 2026? |
| 7 | FAQs: What Is Power BI and How Does It Work? |
Here's the thing about Microsoft Power BI that most explainers skip: it didn't win the BI market by being the flashiest tool. It won by being the one already sitting inside the software most companies already use.
If your organisation runs Excel, Teams, or Microsoft 365, Power BI is often one click away from being switched on, which is exactly why adoption has snowballed.
The numbers support this. Microsoft has been named a Leader in Gartner’s Magic Quadrant for Analytics and Business Intelligence Platforms for 18 consecutive years.
It has also ranked highest on both completeness of vision and ability to execute for seven consecutive years. Gartner describes Power BI’s market presence as “dominant.”
Around 97% of Fortune 500 companies use Power BI somewhere in their operations. Industry estimates also put its BI market share at nearly one-third globally.
That's not a niche tool anymore. That's the default.
Every business generates data: sales figures, website traffic, inventory counts, customer feedback.
The problem was never a shortage of data. It was that most of it sat locked in spreadsheets, databases, or systems that didn't talk to each other, and turning it into something a manager could glance at and understand took analysts days.
Power BI shortens that gap. Reports that once took days of manual pivot-table work can now be automated.
Microsoft’s usage data suggests that self-service reporting with Power BI saves teams over two hours per week on average. Report production is also roughly 2.5 times faster than manual methods.
The working of Power BI is the part most beginner guides gloss over, so let's slow down here.
Power BI Desktop is the free, downloadable application where the actual data modelling happens.
You connect to a data source, an Excel file, a SQL database, a cloud service like Salesforce or Google Analytics, even a plain CSV, and Power BI pulls that data in.
From there, it runs through a process most people never see:
Connect: Power BI links to one or more Power BI data sources.
Transform: Power Query (the built-in transformation engine) cleans, reshapes, and merges the data.
Model: Tables are linked through relationships, and calculations are built using DAX (Data Analysis Expressions), Power BI's formula language.
Visualise: Charts, maps, tables, and KPI cards are dragged onto a canvas to build the report.
Once a report is built in Desktop, it gets published to the Power BI Service, the cloud-based platform at app.powerbi.com.
This is where dashboards actually become useful to a team: reports can be shared, scheduled to refresh automatically, and organised into workspaces with proper access controls, so the finance team isn't accidentally editing marketing's numbers.
The mobile app mirrors dashboards for phones and tablets, with push alerts when a metric crosses a threshold, handy for a regional manager who needs to know the moment sales dip below target, without opening a laptop.
| Component | What is it for | Who uses it |
|---|---|---|
| Power BI Desktop | Building reports and data models | Analysts, report authors |
| Power BI Service | Publishing, sharing, collaborating | Teams, managers |
| Power BI Mobile | Viewing dashboards on the go | Executives, field staff |
| Power BI Gateway | Connecting on premises data to the cloud | IT/data teams |
Power BI data visualisation earns its reputation here. Rather than static charts, you get living, breathing dashboards where clicking one bar filters everything else on the page. A few common builds:
A single-screen view combining KPIs, trend lines, and maps, designed for a five-second glance, not a five-minute read.
Multi-page, drillable Power BI reports where a sales director can click from "total UAE revenue" down to a single branch's weekly figures without opening a second file.
For operations that change by the minute, call centre queues, delivery fleets, live inventory, Power BI can refresh visuals from streaming data sources almost instantly.
The core features of Power BI that keep it different are listed in the table below:
| Feature | Why it matters |
|---|---|
| Copilot in Power BI | Build visuals and summaries using plain-language prompts |
| Natural language Q&A | Type a question, get a chart |
| DAX formulas | Custom calculations beyond basic aggregation |
| Microsoft Fabric integration | Unified data ingestion, storage, and analytics in one environment |
| 100+ data connectors | Pulls from cloud apps, databases, files, and APIs |
| Row-level security | Controls exactly who sees what data |
Gartner specifically called out Copilot for Power BI as a productivity booster for data and analytics workflows.
Microsoft’s deeper integration with Fabric also lets teams manage data ingestion, transformation, and visualisation in one connected environment, reducing tools, handoffs, and system issues.
Want to understand how Power BI compares with other popular data tools? Explore our guide to Excel vs Power BI vs Tableau in Kuwait for a practical comparison of their features, uses, and learning paths.
Here's a stat worth sitting with: enterprise-level companies now use Power BI at nearly double the rate of mid-market firms, and adoption has climbed roughly two percentage points in the past year alone, according to recent procurement data.
Manufacturing, business services, finance, and retail lead the pack of industries running it.
That kind of enterprise dependence has a direct knock-on effect: demand for people who can actually use the tool properly, not just open it, but model data, write DAX, and design dashboards that don't mislead keeps climbing.
Data analyst, BI developer, and reporting analyst roles increasingly list Power BI as a baseline requirement rather than a bonus skill, right alongside SQL and Excel.
A common mistake beginners make is assuming Power BI is "just" a charting tool you can pick up from YouTube clips.
The dashboard-building part is genuinely intuitive, but DAX, data modelling, and performance optimisation for large datasets are where structured Power BI training actually pays for itself, cutting months off the trial-and-error most self-taught learners go through.
A well-built Power BI course mostly covers Power Query transformations, relational data modelling, DAX from fundamentals to advanced measures, and real dashboard projects, the same skill stack employers are screening for.
Yes, and the market data makes a stronger case than any marketing copy could.
With Microsoft holding its Gartner leadership position for an eighteenth straight year, close to a third of the global BI market running on the platform, and enterprise adoption still climbing,
Power BI isn't a trend to wait out; it's infrastructure.
Power BI is more than a tool for creating attractive charts. Its main purpose is to help organizations connect data, analyze information, monitor performance, and communicate business insights clearly. For professionals looking to formally validate their Power BI skills, Power BI Certification can complement practical experience and project-based learning.
Power BI is more than a tool for creating attractive charts. Its main purpose is to help organizations connect data, analyze information, monitor performance, and communicate business insights clearly.
For businesses in Kuwait, Power BI can be applied across areas such as finance, retail, logistics, oil and gas, healthcare, construction, and government-related operations. As organizations generate more data through digital systems, the ability to turn that data into understandable and actionable information is becoming an important business skill.