Request a Callback
+971 43801666
 Mar 06, 2026
The importance of the Gantt Chart in project management is that it enables you to plan timelines clearly, manage task dependencies, track progress visually, and reduce schedule delays across global projects. You use a Gantt Chart to break complex work into structured activities, assign responsibilities, monitor milestones, and control deadlines in real time.
As quoted by the Project Management Institute (PMI), whose standards are widely taught in PMP Certification Courses, “Formal scheduling techniques used by organisations result in projects being completed on time by a large margin, and poor planning practises cause nearly 11% of the world’s investment to be wasted.” With project-related employment set to increase by 33% in 2030, it is no surprise that employers are looking for professionals who can handle project timelines efficiently using formal tools.
World-class companies such as Microsoft, Google, Siemens, and IBM use Gantt Chart-based project scheduling systems in digital platforms to manage global teams and projects. The reality for today’s professionals is that they need to handle multiple projects, be flexible with changing priorities, and work well with global teams. The opportunity, on the other hand, is well-defined: professionals with Gantt Chart expertise can enhance project precision, build better stakeholder relationships, and develop themselves in a rapidly competitive global project scenario.
The following are eight reasons why Gantt charts are important in various sectors like construction, IT, healthcare, manufacturing, and oil & gas.
Gantt Charts Offer Systematic Visual Planning
Gantt Charts Enhance Time and Deadline Management
Gantt Charts Enhance Accountability and Role Definition
Gantt Charts Facilitate Quality Management Activities
Gantt Charts Help in Understanding Dependencies and Critical Path
Gantt Charts Enhance Communication Among Global Teams
Gantt Charts Facilitate Data-Driven Monitoring
Gantt Charts Enhance Governance and Strategic Decision-Making
Let us understand these in more detail.
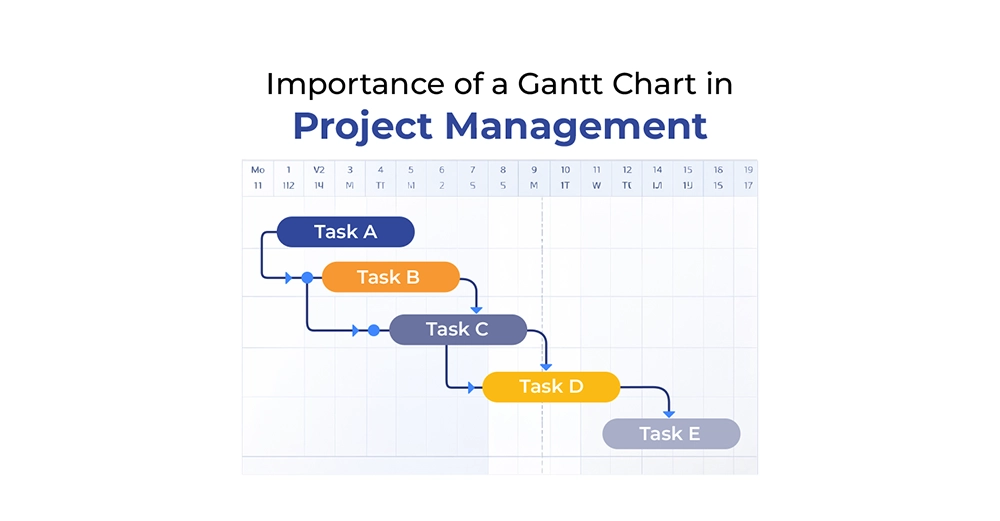
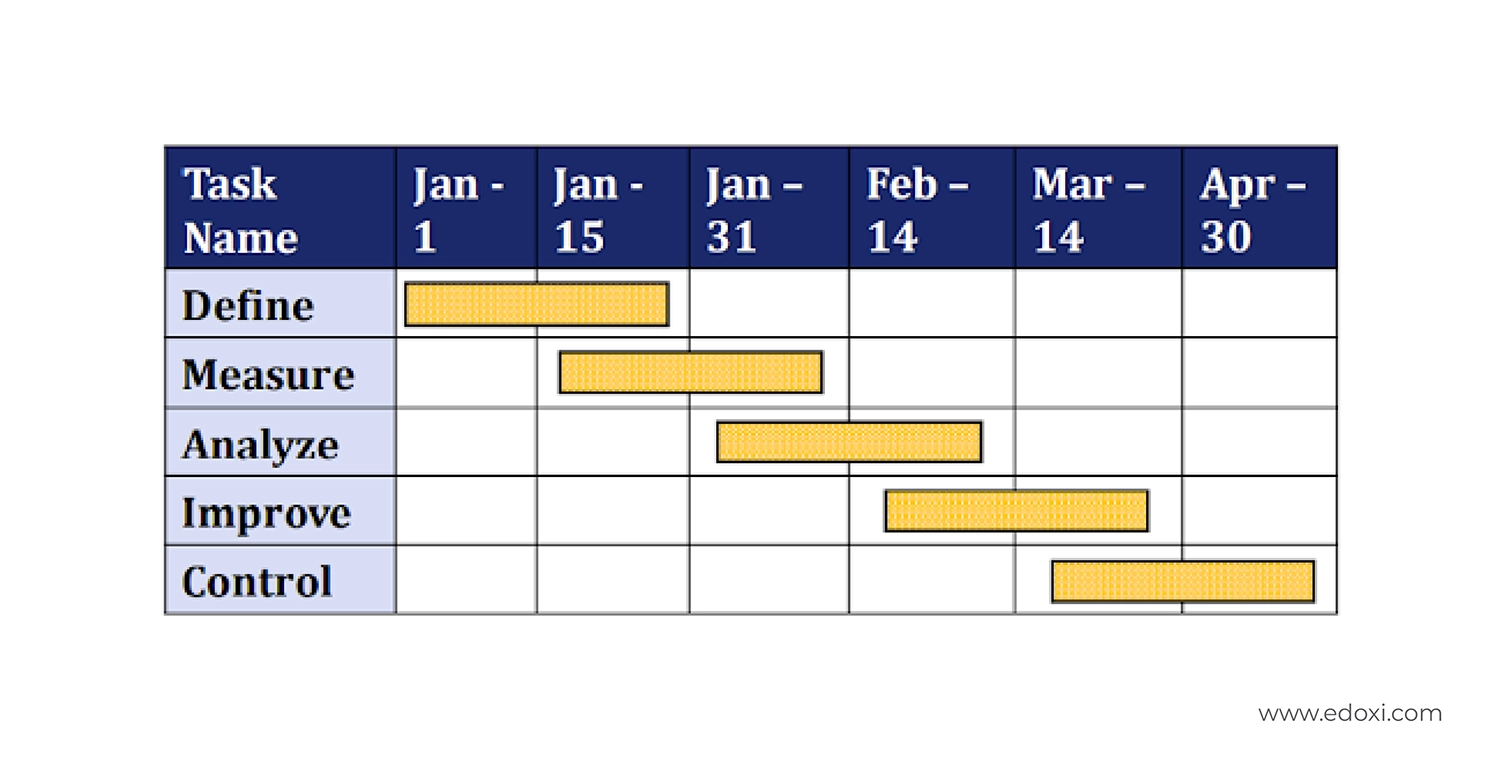
If you ask, what is a Gantt chart, it is a time-based visual scheduling tool that displays project tasks across a horizontal timeline. It shows:
These are the key characteristics of a Gantt chart and the key elements of a Gantt chart. You get the whole life cycle of the project at one glance. You don’t have to depend on disorganised spreadsheets and piecemeal reports. According to Harvard Business Review, visual management helps with coordination and execution. When deadlines are clear in front of teams, productivity increases. Miscommunication goes down.
Visual organisation avoids scheduling conflicts between departments in global IT and construction projects.
Time is one of the most powerful success factors in projects. PMI finds that schedule variances are a major reason for project failure. A Gantt chart assists you in:
If there is a slippage in one activity, you can immediately view the effect. This allows you to take corrective action. In oil & gas projects, delays can result in losses of thousands of dollars per day. In healthcare projects, schedule failures may delay approvals. In IT projects, failure to meet the market release schedule may lead to reduced competitiveness. Effective scheduling enhances predictability.
Clear ownership improves execution. A Gantt chart links tasks directly to responsible individuals. As a Project Manager, you assign deliverables clearly. Your Quality Assurance Manager schedules audits. Your QA Analyst monitors testing cycles. Your Project Sponsor reviews strategic milestones. This clarity strengthens reporting structures. It reduces confusion. It increases accountability.
The World Economic Forum projects that project-oriented roles will grow by nearly 33% by 2030. Employers increasingly demand professionals who can coordinate cross-functional teams effectively. Mastering Gantt charts strengthens your career value globally.
Gantt charts are more than just tracking time; they are used to integrate quality into all stages of a project. By integrating with Plan Quality Management, Manage Quality, and Control Quality, you ensure that quality is proactive and measurable. You can schedule critical activities such as:
For example, in manufacturing projects, Six Sigma reviews can be scheduled, in IT projects, user acceptance testing can be planned, and in construction projects, structural inspections can be scheduled. Lean reviews, Root Cause Analysis, and Control Charts can also be scheduled.
Scheduling quality activities to specific dates enhances accountability, minimises risks, and improves compliance, as per PMP standards.
Unclear sequencing increases rework and cost. A Gantt chart displays task dependencies visually. You see which activities must finish before others begin. You identify the critical path.
McKinsey research on major projects shows that rework can represent up to 30% of project costs. Poor coordination contributes significantly to this loss. In IT, development must finish before testing begins. In healthcare, documentation must be completed before regulatory submission. In manufacturing, procurement must finish before production starts.
Dependency clarity reduces disruption. It improves efficiency.
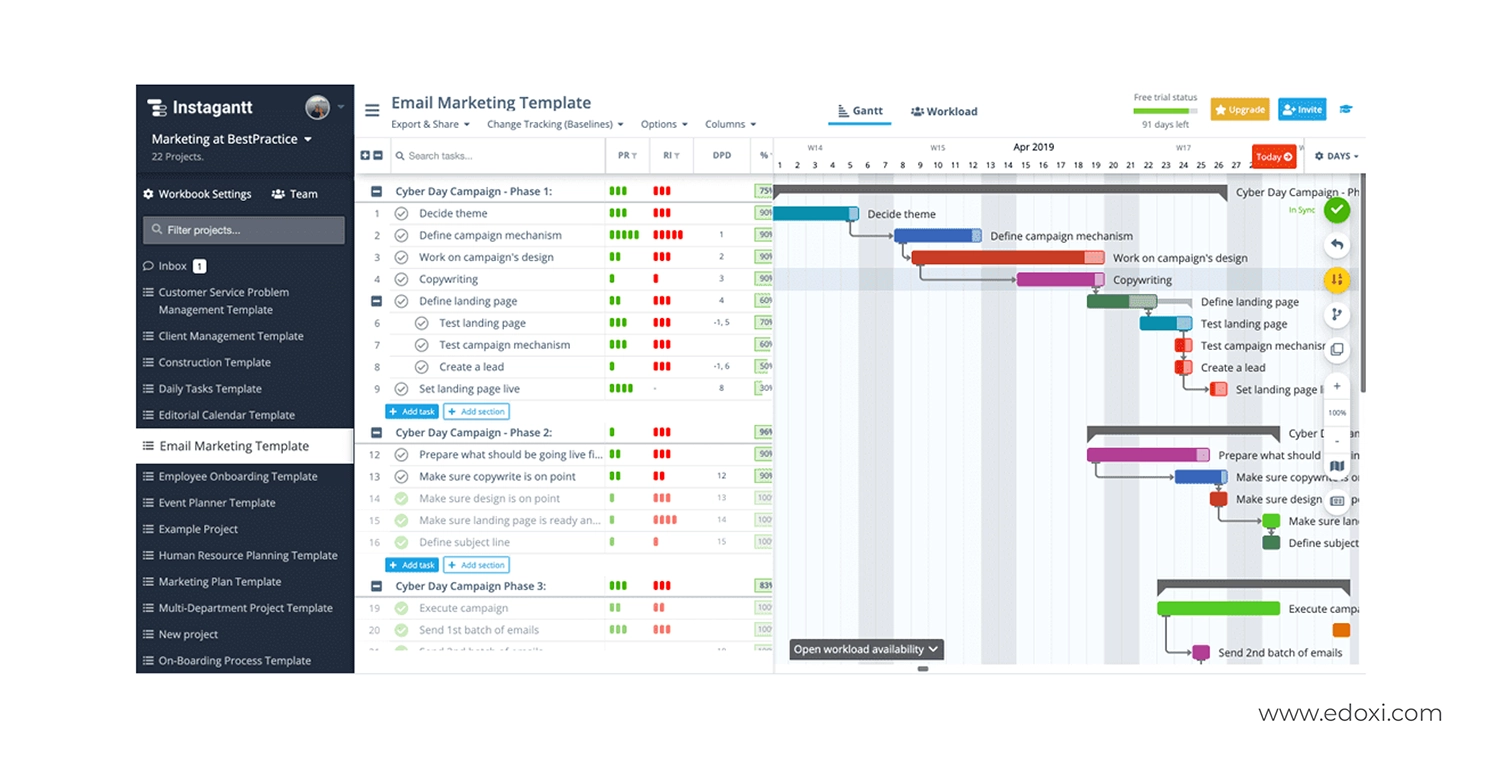
Global teams work in different time zones. Inconsistency raises the risk of delays. The common Gantt chart is the source of truth. All users refer to the same timeline.
Microsoft, Google, and Siemens are among the best global companies using digital Gantt chart scheduling systems. Digital project scheduling systems allow for real-time changes. The systems eliminate reporting inaccuracies. The systems promote transparency. Effective communication enhances consistency in execution.
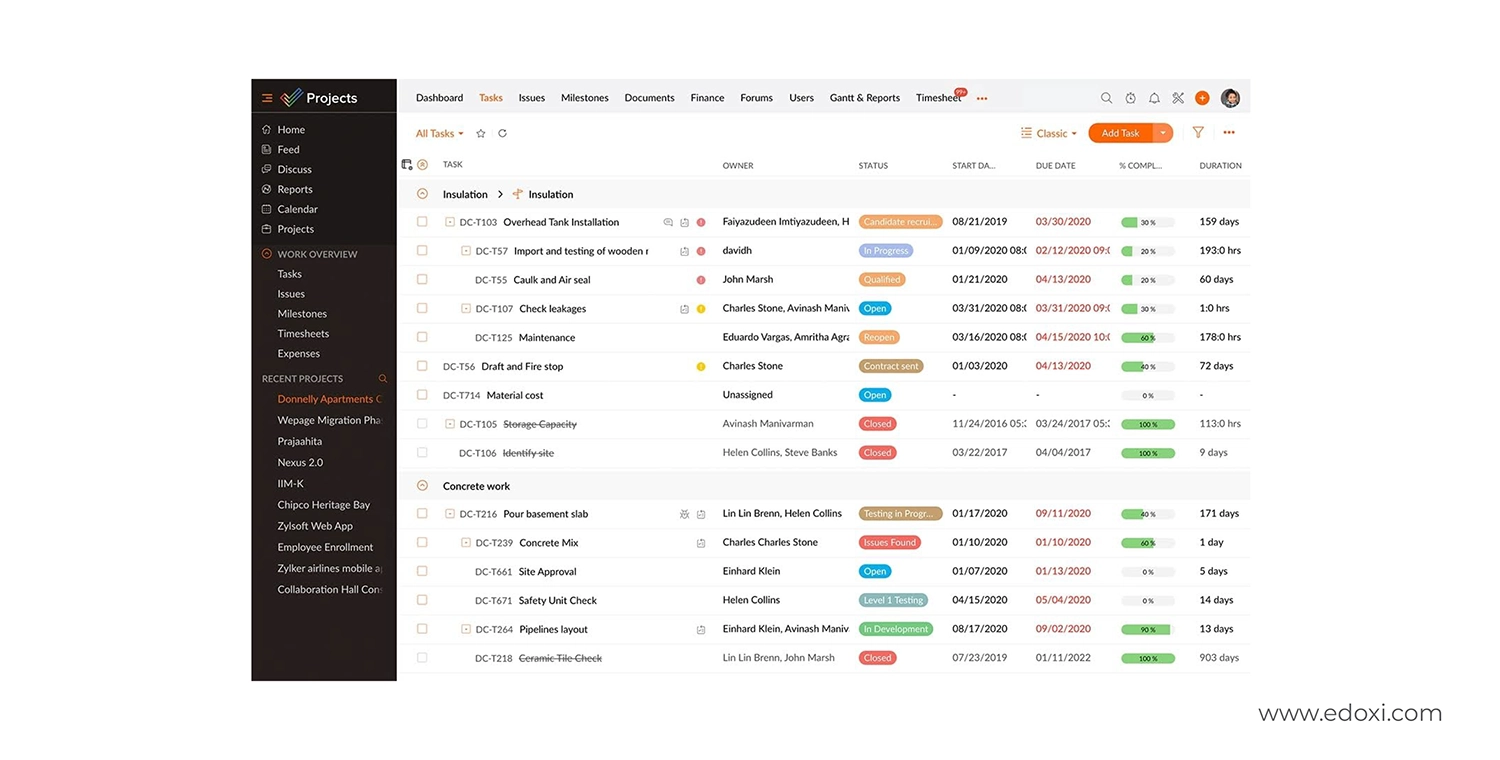
Modern project management depends on measurable performance. A Gantt chart allows you to monitor:
Research by PMI indicates that success rates are higher in organisations that use structured performance measurement systems. By incorporating quality control in project management into your project schedule, you can monitor the effectiveness of compliance. You can schedule audits and monitor the completion of inspections.
Structured monitoring helps in maintaining quality in projects and is in line with the international quality standards of PMP.
Executives require clarity and control. A Gantt chart simplifies reporting. Your Project Sponsor can review:
This clarity improves strategic decisions. It reduces uncertainty. It strengthens governance frameworks. In regulated industries such as healthcare and oil & gas, documented timelines improve audit readiness. When regulatory bodies review compliance records, structured schedules demonstrate control. Strong governance increases stakeholder trust.
You can create a Gantt chart by following the steps given below:
Define Project Scope and Objectives: Articulate what the project must accomplish. Establish measurable objectives, key deliverables, and what success will look like. Ensure the project scope is well understood. Without a clear scope, the project schedule will be doomed from the start.
Break Down the Project into Tasks and Sub-Tasks: Break down the project into smaller, more manageable tasks using a Work Breakdown Structure (WBS). Smaller tasks are more easily planned, assigned, and tracked, and they minimise the risk of overlooking critical work.
Estimate Task Durations: Estimate task durations based on real data, historical information, or industry norms. Refrain from overly aggressive project schedules. Unrealistic project schedules are a leading cause of projects running behind schedule.
Identify Task Dependencies: Determine which tasks must be completed before other tasks can start and which tasks can be done concurrently. Understanding task dependencies helps identify the critical path and organise the project work.
Assign Responsibilities: Assign each task to a specific individual or department. This helps ensure accountability and that tasks are completed on time.
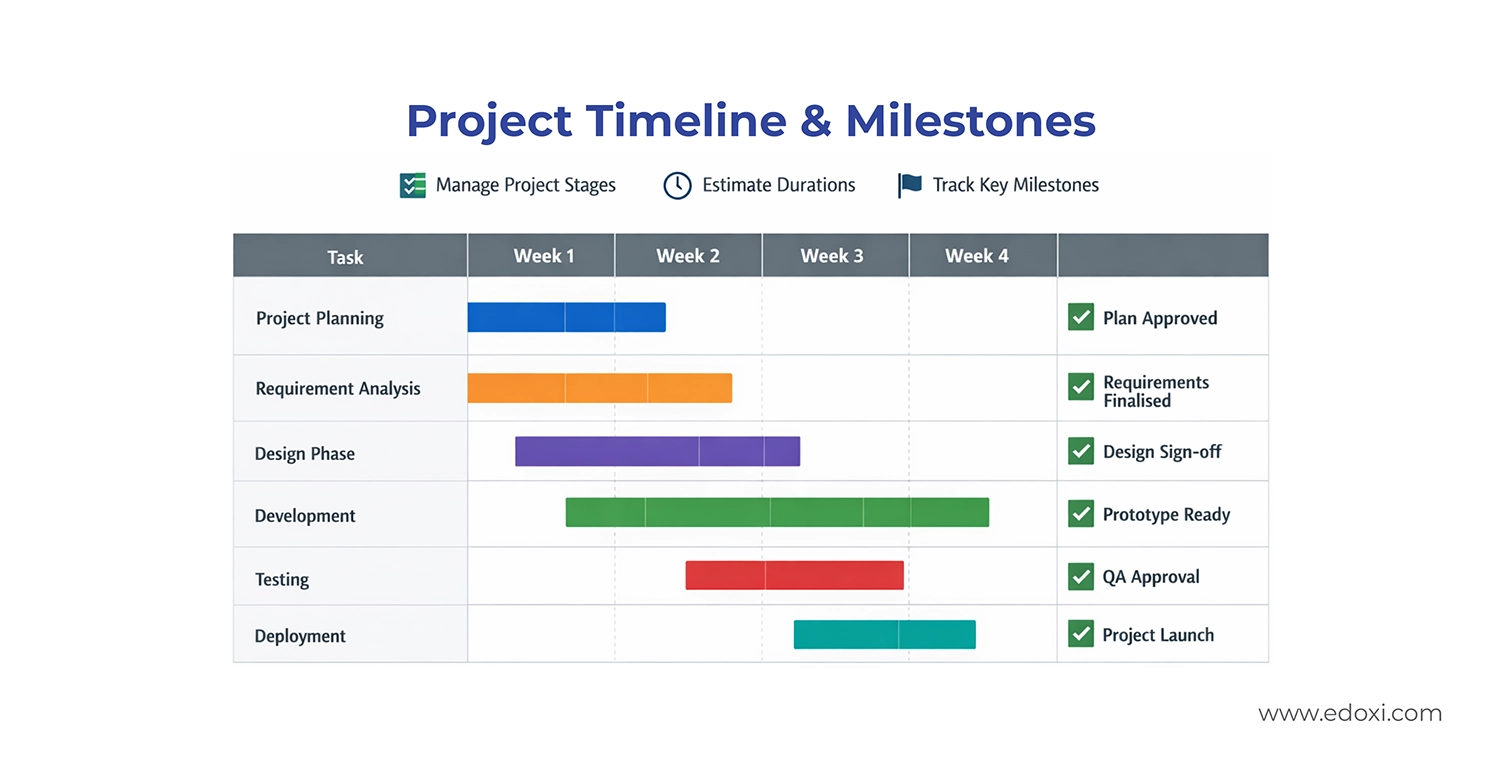
Establish Milestones and Review Points: Add important milestones like approvals, critical deliverables, or quality reviews. Milestones enable you to monitor progress and keep focused on project objectives.
Resource Allocation: Assign the correct people, equipment, and budget to each activity. Resource allocation should be balanced to prevent overloading team members or slowing down progress.
Create the Timeline with a Gantt Chart Tool: Utilise tools like Microsoft Project, Primavera, or Smartsheet to create a graphical timeline. Add task duration, dependencies, and milestones to create a comprehensive timeline.
Track, Measure, and Update Regularly: Track progress on a weekly or bi-weekly basis. Measure performance using metrics such as the Schedule Performance Index (SPI). Update the timeline rapidly when changes occur to keep the project on schedule.
The art of Gantt chart mastery is more than just learning to create timelines; it’s about using those timelines to bring clarity, accountability, and efficiency to every project you undertake. By using timelines to visualise tasks, track progress, understand dependencies, and integrate quality and governance processes, you can eliminate delays, avoid costly rework, and enhance collaboration. For anyone serious about advancing in project management, learning how to create, use, and optimise Gantt charts is a crucial skill that turns complex projects into manageable, successful outcomes. Take the step to strengthen your project planning expertise through structured learning and practical exercises, and see the difference in both your projects and your career growth.
A Gantt chart is a visual project timeline. It is a chart that displays all the tasks in your project and how they relate to one another in terms of their start and end points. This gives you a better overview of the whole project.
Gantt charts show task dependencies through links that connect different tasks in your project. For example, you cannot test a programme unless you have finished coding it.
Yes, Gantt charts can definitely aid in quality control. For example, you can schedule reviews, inspections, or tests. This way, you can ensure nothing is left out, and everything meets the required quality standards before moving on to the next stage.
Yes, Gantt charts can definitely aid in tracking your project’s progress. This way, you can easily assess the situation and see how your project is progressing.