




| Start Date | Duration | Batch Type | Time | Mode | Price | Register |
|---|---|---|---|---|---|---|
| 25-October-2026 | 5 DAYS | Corporate Batch | 09:00 AM - 05:00 PM |
Classroom Kuwait,Kuwait City |
$4,000 USD | |
| 01-November-2026 | 5 DAYS | Corporate Batch | 09:00 AM - 05:00 PM |
Classroom Qatar, Doha |
$4,000 USD | |
| 08-November-2026 | 5 DAYS | Corporate Batch | 09:00 AM - 05:00 PM |
Classroom Kuwait,Kuwait City |
$4,000 USD | |
| 15-November-2026 | 5 DAYS | Corporate Batch | 09:00 AM - 05:00 PM |
Classroom Qatar, Doha |
$4,000 USD | |
| 22-November-2026 | 5 DAYS | Corporate Batch | 09:00 AM - 05:00 PM |
Classroom Kuwait,Kuwait City |
$4,000 USD | |
| 22-November-2026 | 5 DAYS | Corporate Batch | 09:00 AM - 05:00 PM |
Classroom Bahrain,Manama |
$4,000 USD | |
| 22-November-2026 | 5 DAYS | Corporate Batch | 09:00 AM - 05:00 PM |
Classroom Oman, Muscat |
$4,000 USD | |
| 22-November-2026 | 5 DAYS | Corporate Batch | 09:00 AM - 05:00 PM |
Classroom Bahrain,Manama |
$4,000 USD | |
| 06-December-2026 | 5 DAYS | Corporate Batch | 09:00 AM - 05:00 PM |
Classroom Qatar, Doha |
$4,000 USD | |
| 13-December-2026 | 5 DAYS | Corporate Batch | 09:00 AM - 05:00 PM |
Classroom Kuwait, Kuwait City |
$4,000 USD | |
| 13-December-2026 | 5 DAYS | Corporate Batch | 09:00 AM - 05:00 PM |
Classroom Oman, Muscat |
$4,000 USD | |
| 20-December-2026 | 5 DAYS | Corporate Batch | 09:00 AM - 05:00 PM |
Classroom Qatar,Doha |
$4,000 USD | |
| 20-December-2026 | 5 DAYS | Corporate Batch | 09:00 AM - 05:00 PM |
Classroom Oman,Salalah |
$4,000 USD | |
| 27-December-2026 | 5 DAYS | Corporate Batch | 09:00 AM - 05:00 PM |
Classroom Kuwait,Kuwait City |
$4,000 USD |
Select your preferred location and schedule — customised training tailored to your goals.
Edoxi's Data Analysis & Reporting using Power BI course is a hands-on, practitioner-focused programme designed for analysts, finance professionals, and business users seeking to master Microsoft Power BI for modern data analysis and reporting. The training combines analytical concepts with deep hands-on practice using Power BI Desktop, Service, and the wider Microsoft data ecosystem.
Participants gain expertise in connecting to data sources, Power Query data transformation, data modelling, DAX, visualisations, dashboards, Power BI Service, governance, and storytelling. The curriculum aligns with Microsoft's Power BI learning paths and integrates real business scenarios used across finance, sales, operations, HR, and marketing analytics functions across the UAE, GCC, and global markets.
Delivered by experienced data and analytics practitioners, the course emphasises real-world case studies, dashboard-building labs, and end-to-end project exercises that prepare learners for analyst, BI developer, and reporting specialist roles. Whether you are a beginner or an experienced analyst, this programme equips you with the practical skills to deliver high-impact, data-driven insights.
Enrol now to elevate your data analytics expertise and accelerate your reporting career with Power BI.
Intensive 40-hour training covering Power BI Desktop, Service, modelling, DAX, and dashboarding essentials thoroughly with strong practical focus.
Learn from senior data and analytics professionals with extensive Power BI, finance, and business intelligence experience across diverse global industries and sectors.
Curriculum aligns with Microsoft Power BI learning paths and PL-300 certification topics used globally by data analysts across enterprises and consultancies worldwide today.
Engage with real business dashboards, end-to-end labs, and analytics case studies drawn from finance, sales, operations, and global marketing analytics environments.
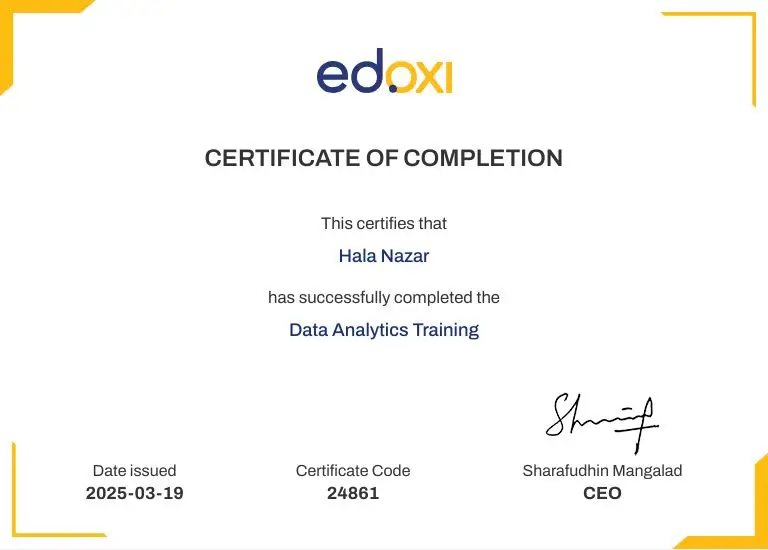
Receive an Edoxi Certificate of Completion respected by employers across analytics, finance, technology, and business intelligence industries worldwide and across the region.
Choose from classroom, online, or corporate formats designed to suit professional schedules, learning styles, and team development needs.
Data analysts and BI specialists seeking advanced Power BI expertise to design dashboards, models, and analytics solutions across modern enterprise data environments globally.
Finance and accounting professionals expanding their analytical skills to build management dashboards, financial reports, and KPI analytics using Power BI across organisations.
Business analysts and consultants supporting decision-making seeking practical Power BI capabilities to deliver insightful analytics across operations, marketing, and strategy functions effectively.
Operations and supply chain analysts building performance dashboards and analytics solutions across procurement, logistics, and production functions in modern global enterprises.
Marketing and sales analysts using Power BI to track campaigns, pipelines, customer behaviour, and revenue performance across modern digital and global business environments.
IT and reporting professionals supporting BI platforms, governance, and analytics tools across enterprise environments seeking advanced Power BI capabilities and platform mastery effectively.
By completing Edoxi's Data Analysis & Reporting using Power BI, you will build the skills to advance your career.

Here's a four-step guide to becoming a certified professional.

Join Edoxi's Data Analysis & Reporting using Power BI Course
Edoxi is the top choice for Data Analysis & Reporting using Power BI. Here's why:
Learn from senior data and analytics professionals with decades of Power BI, finance, and business intelligence experience across diverse global industries, geographies, and complex sectors worldwide.
Our programme aligns with Microsoft Power BI learning paths and PL-300 certification topics, designed for immediate workplace application and meaningful long-term analytics career impact.
Earn an Edoxi certificate trusted by employers across the UAE, GCC, and international analytics markets enhancing professional credibility, career mobility, and long-term professional recognition.
Choose classroom, online, or corporate training formats designed to accommodate busy schedules, individual learning preferences, and corporate team development requirements effectively.
Access detailed study guides, sample datasets, dashboard templates, and case studies that support continued learning long after the course completion ends successfully.
Benefit from career guidance, resume reviews, interview preparation, and networking opportunities to accelerate your analytics career growth and long-term professional progression.

This course is ideal for data analysts, BI developers, finance and accounting professionals, business analysts, marketing and operations analysts, and IT professionals seeking advanced Power BI expertise.
Participants should have a basic understanding of Excel and business data concepts. Prior experience with reporting or analytics is helpful but not mandatory for joining.
The course covers Power BI Desktop, Service, Power Query, DAX, data modelling, dashboards, workspaces, apps, dataflows, row-level security, and AI-driven analytics features.
Yes, learners receive an Edoxi Certificate of Completion upon successfully finishing the training and assessments. The certificate is recognised by employers across the UAE and internationally.
The course is offered in three flexible modes: instructor-led classroom training at Edoxi centres, live online virtual sessions, and customised corporate training delivered on-site for organisational teams.
| Job Role | Average Annual Salary (USD) |
|---|---|
| Data Analyst | $78,000 |
| Power BI Developer | $92,000 |
| Business Intelligence Analyst | $95,000 |
| Reporting Specialist | $72,000 |
| Financial Analyst | $82,000 |
| BI Consultant | $110,000 |


