




| Start Date | Duration | Batch Type | Time | Mode | Register |
|---|---|---|---|---|---|
| 07 Dec 2026 | 18 Hours | Weekday | 09:00 AM - 01:00 PM |
Online Online |
|
| 28 Dec 2026 | 18 Hours | Weekend | 10:00 AM - 02:00 PM |
Classroom Dubai |
|
| 18 Jan 2027 | 18 Hours | Weekday | 09:00 AM - 01:00 PM |
Online Online |
Select your preferred location and schedule — customised training tailored to your goals.
Edoxi's Advanced Data Visualisation and Data Storytelling training helps participants develop executive-ready dashboards, narratives, and insight-led presentations from business data. The programme moves beyond basic charting to focus on how data can be shaped into a compelling story that drives decisions at the executive level.
Through hands-on exercises using real business datasets, learners explore how to design clear, focused dashboards, apply strong visual design principles, and structure presentations that lead with insight rather than raw numbers. The course also covers how to communicate complex analysis to non-technical stakeholders, ensuring data-driven recommendations are understood and acted upon quickly.
Whether you work in analytics, business intelligence, or reporting, this training equips you with the skills to turn data into narratives that influence decisions and drive results.
Enrol now to transform the way you present data and the decisions it drives.
Build real executive-ready dashboards during the course using business datasets, giving you practical experience you can apply immediately to your own reporting.
Work through storytelling exercises based on real business scenarios, helping you translate raw data into narratives that resonate with decision-makers and stakeholders.
Learn from experienced trainers with real analytics and business intelligence insight, sharing practical examples that make advanced visualisation concepts easier to apply.
Gain access to proven visual design principles covering colour, layout, and chart selection, helping you avoid common mistakes that weaken data presentations.
Choose from classroom, online, or corporate training formats, allowing you to build data storytelling expertise in a way that best fits your schedule and role.
Data analysts who regularly present findings will strengthen their ability to design clear dashboards and structure insights into narratives that stakeholders can act on quickly.
Business intelligence professionals building reporting tools will learn how to design executive-ready dashboards that highlight key metrics without overwhelming users.
Managers and team leads who report performance to leadership will gain storytelling techniques that make their updates more persuasive and easier to understand.
Marketing and sales professionals presenting campaign or performance data will benefit from insight-led presentation techniques that strengthen their case to stakeholders.
Consultants and strategy professionals preparing client-facing reports will develop the visual and narrative skills needed to present complex findings with clarity and impact.
Build the skills to turn business data into executive-ready dashboards and narratives that drive confident decision-making.

Follow these simple steps to earn your Edoxi certification and validate your data visualisation and storytelling skills.
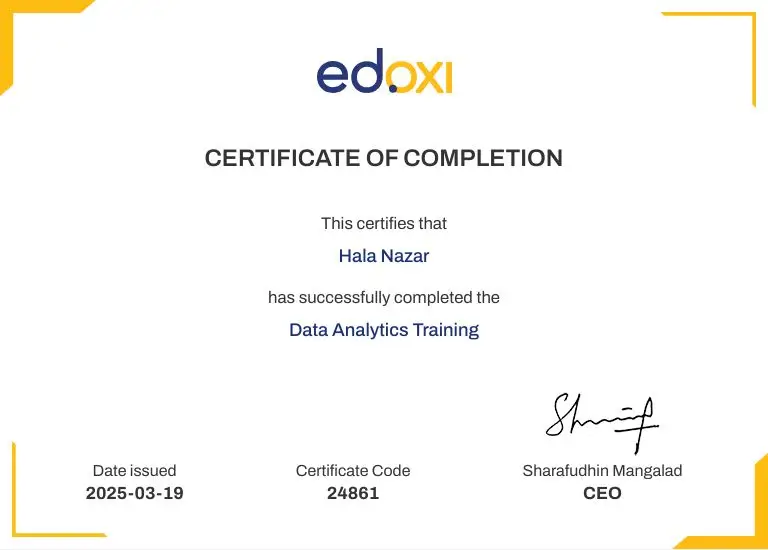

Speak to our advisors about certification pathways.
Edoxi combines expert trainers, hands-on dashboard practice, and flexible learning options to help you master data storytelling.
Edoxi is a KHDA-approved training institute, giving you the assurance that your certification meets recognised quality and educational standards trusted across industries.
Learn from trainers with real analytics and business intelligence experience who bring practical, relevant examples into every session, making advanced concepts easier to apply.
Choose from classroom, online, or corporate training options, allowing you to build your data visualisation skills in a format that suits your schedule.
Our training emphasises building real dashboards and presentations, ensuring you leave with skills you can apply immediately to your own reporting.
Join a growing community of over 1,150 learners who have completed this course, giving you access to valuable networking and professional development opportunities.

This course is ideal for data analysts, business intelligence professionals, managers, marketing and sales professionals, and consultants who present data to stakeholders.
No prior experience is required. The course is designed to build data visualisation and storytelling skills from the ground up.
You will gain dashboard design, data storytelling, insight-led presentation building, visual design principles, and stakeholder communication skills.
Yes, the course is available in classroom, online, and corporate training formats to suit your schedule and learning preference.
Yes, participants who complete the training and pass the practical assessment receive an Edoxi certification recognised by employers.
| Job Role | Average Annual Salary (USD) |
|---|---|
| Data Analyst | $65,000 |
| Business Intelligence Analyst | $78,000 |
| Data Visualisation Specialist | $82,000 |
| Analytics Manager | $95,000 |


