Request a Callback

+971 4380 1666
 Aug 15, 2026

Learning Power BI is not primarily a matter of learning where each button is located. The real skill lies in understanding how data moves from an untidy source to a reliable conclusion.
Power BI brings together data preparation, modeling, calculations, visualization, and reporting. Microsoft’s own learning framework reflects this progression: users begin by obtaining and preparing data, then move into modeling, DAX, reporting, analysis, and the Power BI service.
For that reason, beginners are better served by learning Power BI as a sequence of related ideas rather than as a collection of isolated features
A common mistake is to open Power BI and immediately start choosing charts. That approach can produce an attractive report without producing a sound analysis.
Begin instead with a simple question: What information am I trying to understand?
Take a sales dataset. Before creating a visual, you should know what constitutes a sale, how an order is identified, which fields describe the product and customer, and how dates are recorded. These details determine whether the eventual report can be trusted.
A basic understanding of tables, fields, data types, aggregation, filtering, and relationships is therefore a useful foundation.
Power BI Desktop is the main working environment for building reports and models. It provides the tools needed to connect to data, transform it, establish relationships, create calculations, and design reports.
At this stage, resist the temptation to learn everything. Import an Excel or CSV file and become comfortable creating a few useful visuals. Learn how filters affect a report and how different views of the same data can answer different questions.
The objective is not to produce a sophisticated dashboard. It is to understand the relationship between the data and the report.
Real data is rarely ready for analysis.
Power Query is the part of Power BI used to extract, clean, reshape, and prepare data. Its capabilities include changing data types, removing unwanted records, combining sources, pivoting data, and profiling columns.
This is an important distinction: data preparation and data analysis are different tasks.
If a column contains inconsistent dates, fix the data rather than attempting to compensate for the problem with increasingly complicated formulas. A well-prepared dataset reduces complexity later.
Once the data is prepared, the next question is how the tables should relate to one another.
This is where data modeling becomes important. Learn the difference between fact and dimension tables, understand relationships and cardinality, and become familiar with the star-schema approach.
Microsoft's intermediate Power BI curriculum places semantic modeling, relationships, calculations, DAX, filter context, and time intelligence at the center of this stage.
The reason is straightforward: a calculation is only as meaningful as the model behind it.
DAX is where Power BI becomes considerably more analytical.
You can create useful reports without knowing much DAX, but serious analysis eventually requires it. DAX allows calculations to respond to the context in which data is being viewed—for example, calculating sales for a particular region, period, product category, or combination of filters.
Begin with measures and basic functions such as SUM, COUNT, DISTINCTCOUNT, and DIVIDE. From there, move into CALCULATE, filter context, variables, iterators, and time intelligence.
Do not treat DAX as a list of formulas to memorize. Learn the reasoning behind the calculation. That understanding will remain useful when the dataset changes.
Good Power BI reports are not collections of charts. They are explanations.
A line chart may be appropriate when the question concerns change over time. A bar chart may make comparison easier. A table may be preferable when precise values matter.
The visual should serve the question.
A well-designed report establishes a hierarchy: important measures receive prominence, supporting information is available when needed, and unnecessary decoration is removed. The best dashboard is often the one that allows a reader to understand the situation without having to interpret the design first.
Power BI Desktop and the Power BI service have different roles. Desktop is particularly suited to modeling and report creation, while the service supports publishing, sharing, collaboration, refresh, and access management.
Once the fundamentals are established, learn workspaces, publishing, refresh, permissions, and row-level security. These topics become important when reports move from personal analysis into organizational use.
The strongest way to consolidate these skills is to build complete projects. If you prefer guided learning, a Power BI course in Dubai can also provide a structured environment for practicing these concepts with instructor support.
The strongest way to consolidate these skills is to build complete projects.
Take a sales dataset and start with a question such as:
Then work through the entire process:
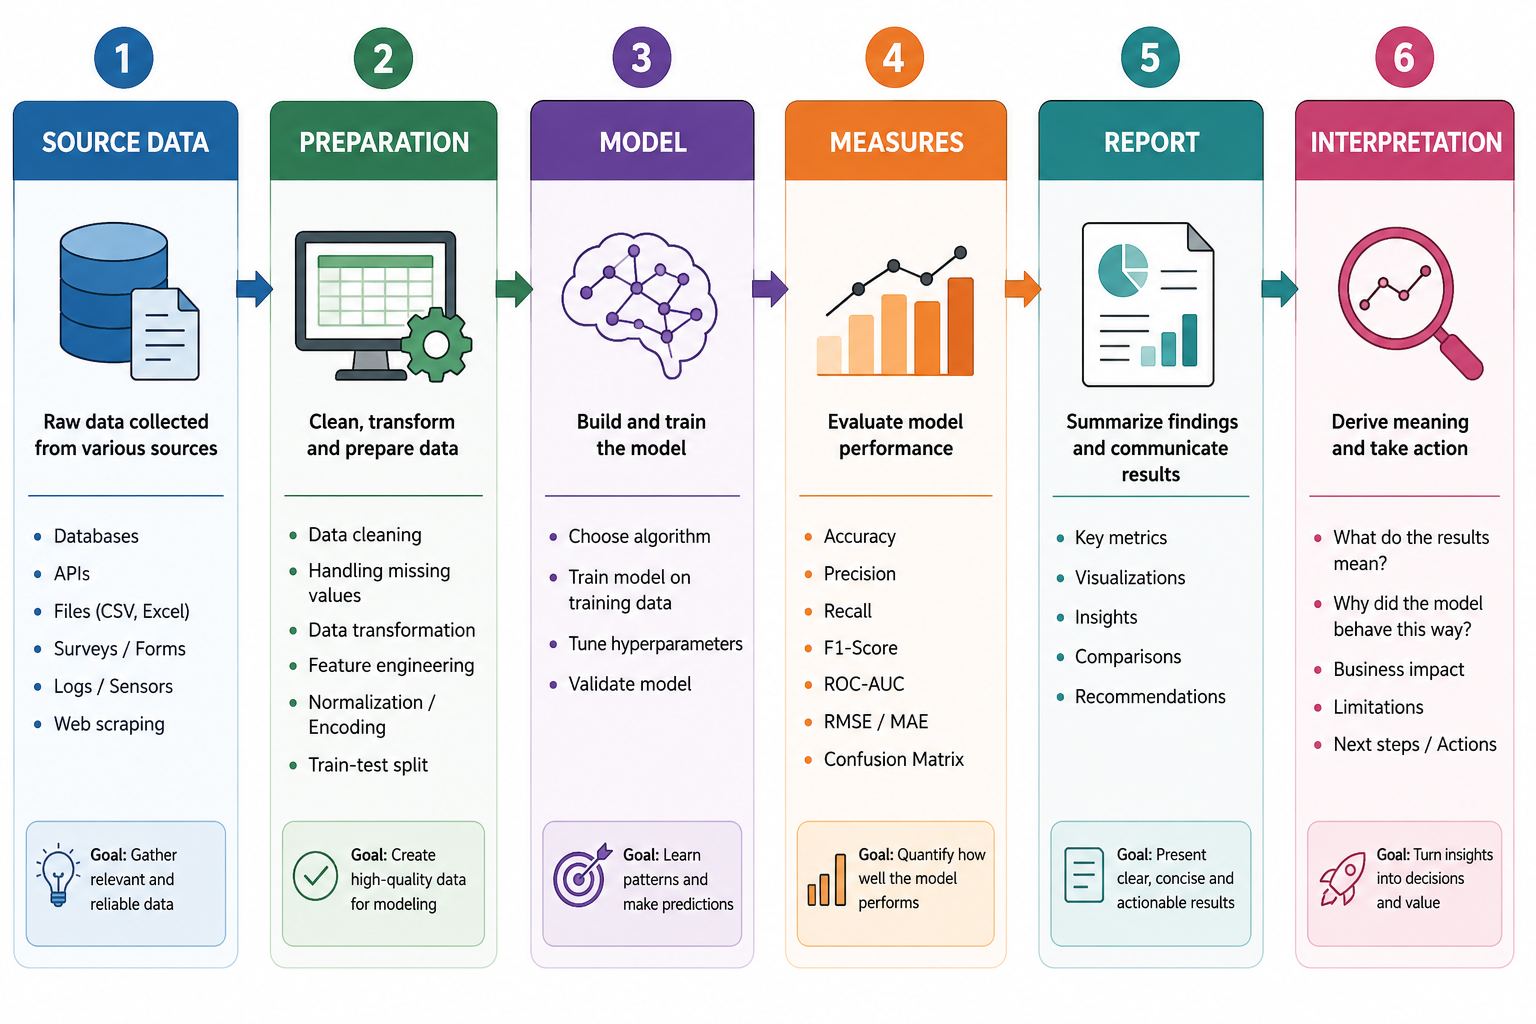
Do not stop when the charts appear. Check the figures against the source, investigate unexpected results, and write down what the analysis actually reveals.
That final step separates dashboard construction from data analysis.
You can begin Power BI without programming experience. Excel knowledge is useful, particularly because spreadsheets remain a common business data source. SQL becomes increasingly valuable as your work moves toward relational databases and larger analytical environments.
A strong long-term combination is therefore:
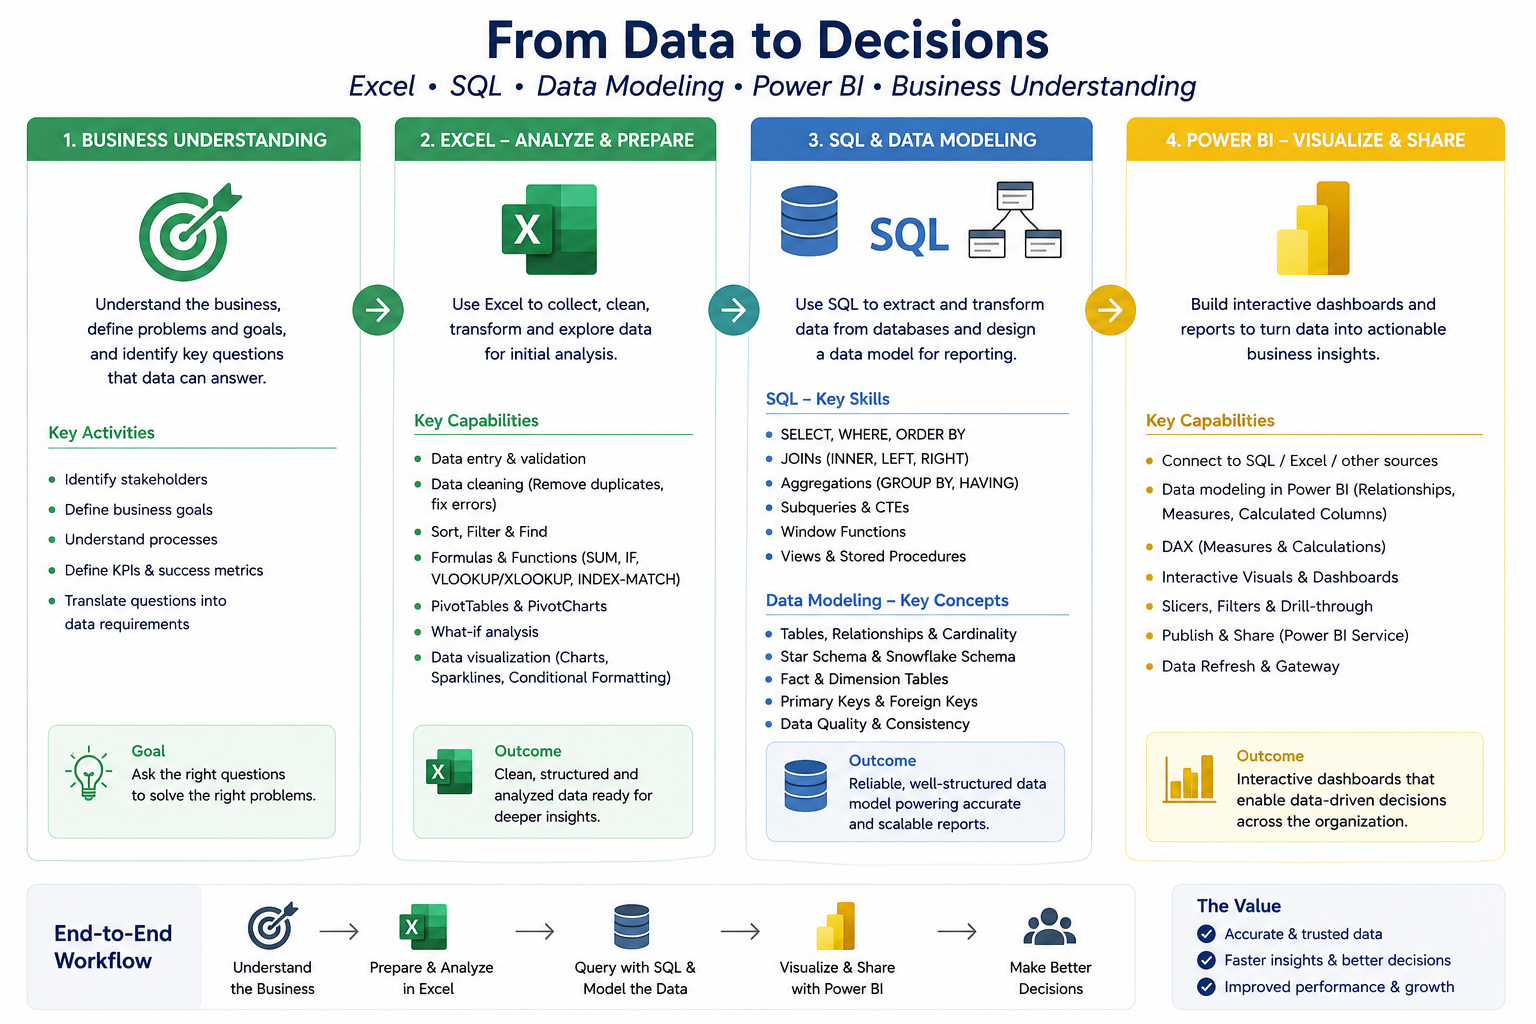
The tools matter, but the ability to frame a useful question and interpret the answer matters more.
There is no meaningful universal number of days.
A person who already understands Excel and business reporting may progress quickly through the fundamentals. Someone new to data analysis will need more time to develop the underlying concepts.
A better measure of progress is independence.
When you can receive an unfamiliar dataset, determine what is wrong with it, prepare it, model it, create appropriate calculations, produce a clear report, and explain the findings without following a tutorial, you have moved beyond the beginner stage.
Power BI is easiest to learn when its features are studied in the order in which analytical work actually happens.
Understand the data. Prepare it carefully. Build a sound model. Learn DAX. Design the analysis clearly. Publish and manage the result.
That sequence is more valuable than memorizing a long catalogue of Power BI features.
And the most productive habit is simple: every new concept should be tested against a real dataset. That is how Power BI knowledge becomes analytical judgment rather than software familiarity.